Imagery and Remote Sensing Blog

cancel
Showing results for 
Show  only  | Search instead for 
Did you mean: 

Other Boards in This Place

Latest Activity

(65 Posts)
Elizabeth
Esri Contributor

Discover Synthetic Aperture Radar (SAR) Imagery and Remote Sensing capabilities at Esri and find resources describing how to process and analyze SAR satellite imagery in ArcGIS Pro with the Image Analyst extension. 

Read more...

more
0 0 398
MaddeVoas
Esri Contributor

Explore new content on the ArcGIS Imagery Workflows website, which provides a jumping off point for accomplishing imagery tasks using ArcGIS.

Read more...

more
1 0 345
MaddeVoas
Esri Contributor

The number of satellites orbiting Earth is growing rapidly; many are used to observe our planet. And satellites are just one way to obtain geospatial imagery—there are also drones, planes, and terrestrial sensors capturing more imagery data each day.

Whether you’re a public works department looking to track assets or a governmental organization trying to keep abreast of natural disasters, as your imagery data continues to climb in volume, you might be asking yourself how you or your organization can manage it all while still being able to process your data, perform analyses, and share your findings with stakeholders. Why not have the flexibility to do it all in one place?

This is where a comprehensive imagery system comes in. Learn how ArcGIS can be leveraged from end-to-end to meet all your imagery needs. Interested?

Download the technical paper


more
1 0 351
VinayViswambharan
Esri Contributor

With the firehose of imagery that’s streaming down daily from a variety of sensors, the need for using AI to automate feature extraction is only increasing. To make sure your organization is prepared, Esri is taking AI to the next level. We are very excited to announce the release of ready-to-use geospatial AI models on the ArcGIS Living Atlas.

Article Overview: Esri is bringing ready-to-use deep learning models to our user community through ArcGIS Online.

To kick it off, we’ve added three models — building footprint extraction and land cover classification from satellite imagery, and another model to classify points representing trees in point cloud datasets.

With the existing capabilities in ArcGIS, you’ve been able to train over a dozen deep learning models on geospatial datasets and derive information products using the ArcGIS API for Python or ArcGIS Pro, and scale up processing using ArcGIS Image Server.

Building footprints automatically extracted using the new deep learning model

These newly released models are a game changer! They have been pre-trained by Esri on huge volumes of data and can be readily used (no training required!) to automate the tedious task of digitizing and extracting geographical features from satellite imagery and point cloud datasets. They bring the power of AI and deep learning to the Esri user community. What’s more, these deep learning models are accessible for anyone with an ArcGIS Online subscription at no additional cost.


Using the models

Using these models is simple. You can use geoprocessing tools (such as the Detect Objects Using Deep Learning tool) in ArcGIS Pro with the imagery models.  Point the tool to the imagery and the downloaded model, and that’s about it – deep learning has never been this easy! A GPU, though not necessary, can help speed things up. With ArcGIS Enterprise, you can scale up the inferencing using Image Server.

Using the model in ArcGIS Pro
Using the building footprint extraction model in ArcGIS Pro

Coming soon, you’ll be able to consume the model directly in ArcGIS Online Imagery and run it against your own uploaded imagery—all without an ArcGIS Enterprise deployment. The 3D Basemaps solution is also being enhanced to use the tree point classification model and create realistic 3D tree models from raw point clouds.


How can you benefit from these deep learning models?

It probably goes without saying that manually extracting features from imagery—like digitizing footprints or generating land cover maps—is time-consuming. Deep learning automates the process and significantly minimizes the manual interaction needed to create these products. However, training your own deep learning model can be complicated – it needs a lot of data, extensive computing resources, and knowledge of how deep learning works.


Sample building footprints extracted - Woodland, CA

With ready-to-use models, you no longer have to invest time and energy into manually extracting features or training your own deep learning model. These models have been trained on data from a variety of geographies and work well across them. As new imagery comes in, you can readily extract features at the click of a button, and produce layers of GIS datasets for mapping, visualization and analysis.

Sample building footprints extracted - Palm Islands, Dubai


Get to know the first three models we released

Three deep learning models are now available in ArcGIS Online. (Watch for more models in the future!). These models are available as deep learning packages (DLPKs) that can be used with ArcGIS Pro, Image Server and ArcGIS API for Python.

1. Building Footprint Extraction model is used to extract building footprints from high resolution satellite imagery. While its designed for the contiguous United States, it performs fairly well in other parts of the globe.

The model performs fairly well in other parts of the globe. Results from Ulricehamn, Sweden.

Here’s a story map presenting some of the results. Building footprint layers are useful for creating basemaps and in analysis workflows for urban planning and development, insurance, taxation, change detection, and infrastructure planning.

2. Landcover Classification model is used to create a land cover product using Landsat 8 imagery. The classified land cover will have the same classes as the National Land Cover Database. The resulting land cover maps are useful for urban planning, resource management, change detection and agriculture.

Classified landcover map using Landsat 8 imagery

This generic model is has been trained on the National Land Cover Database (NLCD) 2016 with the same Landsat 8 scenes that were used to produce the database. Land cover classification is a complex exercise and is hard to capture using traditional means. Deep learning models have a high capacity to learn these complex semantics and give superior results.

3. Tree Point Classification model can be used to classify points representing trees in point cloud datasets.

Interactive 3D basemap created by employing tree point classification model.
3D scene created by employing tree point classification model.

Classifying tree points is useful for creating high quality 3D basemaps, urban planning and forestry workflows.


Next steps

Try out the deep learning models in ArcGIS Living Atlas for yourself. Read more detailed instructions for using the deep learning models in ArcGIS. Have questions? Let us know on GeoNet how they are working for you, and which other feature extraction tasks you’d like AI to do for you!

more
0 3 2,323
VinayViswambharan
Esri Contributor

The ArcGIS Image Analyst extension for ArcGIS Pro 2.5 now features expanded deep learning capabilities, enhanced support for multidimensional data, enhanced motion imagery capabilities, and more.

Learn about  new imagery and remote sensing-related features added in this release to improve your image visualization, exploitation, and analysis workflows.

Deep Learning

We’ve introduced several key deep learning features that offer a more comprehensive and user-friendly workflow:

  • The Train Deep Learning Model geoprocessing tool trains deep learning models natively in ArcGIS Pro. Once you’ve installed relevant deep learning libraries (PyTorch, Fast.ai and Torchvision), this enables seamless, end-to-end workflows.
  • The Classify Objects Using Deep Learning geoprocessing tool is an inferencing tool that assigns a class value to objects or features in an image. For instance, after a natural disaster, you can classify structures as damaged or undamaged.
  • The new Label Objects For Deep Learning pane provides an efficient experience  for managing and  labelling training data. The pane also provides the option to export your deep learning data.
  • A new user experience lets you interactively review deep learning results and edit classes as required.
New deep learning tools in ArcGIS Pro 2.5

New deep learning tools in ArcGIS Pro 2.5

Multidimensional Raster Management, Processing and Analysis

New tools and capabilities for multidimensional analysis allow you to extract and manage subsets of a multidimensional raster, calculate trends in your data, and perform predictive analysis.

New user experience

A new contextual tab in ArcGIS Pro makes it easier to work with multidimensional raster layers or multidimensional mosaic dataset layers in your map.

Intuitive user experience to work with multidimensional data

Intuitive user experience to work with multidimensional data

  • You can Intuitively work with multiple variables and step through time and depth.
  • You have direct access to the new functions and tools that are used to manage, analyze and visualize multidimensional data.
  • You can chart multidimensional data using the temporal profile, which has been enhanced with spatial aggregation and charting trends.

New tools for management and analysis

The new multidimensional functions and geoprocessing tools are listed below.

New geoprocessing tools for management

We’ve added two new tools to help you extract data along specific variables, depths, time frames, and other dimensions:

  • Subset Multidimensional Raster
  • Make Multidimensional Raster layer

New geoprocessing tools for analysis

  • Find Argument Statistics allows you to determine when or where a given statistic was reached in multidimensional raster dataset. For instance, you can identify when maximum precipitation occurred over a specific time period.
  • Generate Trend Raster estimates the trend for each pixel along a dimension for one or more variables in a multidimensional raster. For example, you might use this to understanding how sea surface temperature has changed over time.
  • Predict Using Trend Raster computes a forecasted multidimensional raster using the output trend raster from the Generate Trend Raster tool. This could help you predict the probability of a future El Nino event based on trends in historical sea surface temperature data.

Additionally, the following tools have improvements that support new analytical capabilities:

New raster functions for analysis

  • Generate Trend
  • Predict Using Trend
  • Find Argument Statistics
  • Linear Spectral Unmixing
  • Process Raster Collection

New Python raster objects

Developers can take advantage of new classes and functions added to the Python raster object that allow you to work with multidimensional rasters

New classes include:

  • ia.RasterCollection – The RasterCollection object allows a group of rasters to be sorted and filtered easily and prepares a collection for additional processing and analysis.
  • ia.PixelBlock – The PixelBlock object defines a block of pixels within a raster to use for processing. It is used in conjunction with the PixelBlockCollection object to iterate through one or more large rasters for processing.
  • ia.PixelBlockCollection – The PixelBlockCollection object is an iterator of all PixelBlock objects in a raster or a list of rasters. It can be used to perform customized raster processing on a block-by-block basis, when otherwise the processed rasters would be too large to load into memory.

New functions include:

  • ia.Merge() – Creates a raster object by merging a list of rasters spatially or across dimensions.
  • ia.Render (inRaster, rendering_rule={…}) – Creates a rendered raster object by applying symbology to the referenced raster dataset. This function is useful when displaying data in a Jupyter notebook.
  • Raster functions for arcpy.ia – You can now use almost all of the raster functions to manage and analyze raster data using the arcpy API
New tools to analyse multidimensional data

New tools to analyse multidimensional data

Motion Imagery

This release includes enhancements to our motion imagery support, so you can better manage and interactively use video with embedded geospatial metadata:

  • You can now enhance videos in the video player using contrast, brightness, saturation, and gamma adjustments. You can also invert the color to help identify objects in the video.
  • Video data in multiple video players can be synchronized for comparison and analysis.
  • You can now measure objects in the video player, including length, area, and height.
  • You can list and manage videos added to your project with the Video Feed Manager.
Motion imagery in ArcGIS Pro

Pixel Editor

The Pixel Editor provides a suite of tools to interactively manipulate pixel values of raster and imagery data. Use the toolset for redaction, cloud and noise removal, or to reclassify categorical data. You can edit an individual pixel or a group of pixels at once. Apply editing operations to pixels in elevation datasets and multispectral imagery. Key enhancements in this release include the following:

  • Apply a custom raster function template to regions within the image
  • Interpolate elevation surfaces using values from the edges of a selected region

Additional resources

more
0 0 978
JeffLiedtke
Esri Contributor

Using your knowledge of geography, geospatial and remote sensing science, and using the image classification tools in ArcGIS, you have produced a pretty good classified raster for your project area. Now it’s time to clean up some of those pesky pixels that were misclassified – like that one pixel labelled “shrub” in the middle of your baseball diamond. The fun part is using the Pixel Editor to interactively edit your classified raster data to be useful and accurate. The resulting map can be used to drive operational applications such as land use inventory and management.

For operational management of land use units, a useful classified map may not necessarily be the most accurate in terms of identified features. For example, a small clearing in a forest, cars in a parking lot, or a shed in a backyard are not managed differently than the larger surrounding land use. The Pixel Editor merges and reclassifies groups of pixels, objects and regions quickly and easily into units that can be managed similarly, and result in presentable and easy-to-understand maps for your decision support and management.

What is the Pixel Editor?

The Pixel Editor is an interactive group of tools that enables editing of raster data and imagery , and it is included with the ArcGIS Pro Image Analyst. It is a suite of image processing capability, driven by an effective user interface, that allows you to interactively manipulate pixel values. Try different operations using different parameter settings to achieve optimum editing results, then save, publish and share them.

The Pixel Editor is contextual to the raster source type of the layer being edited, which means that suites of capability are turned on or off depending on the data type of the layer you are working with. For thematic data, you can reassign pixels, objects and regions to different classes, perform operations such as filtering, shrinking or expanding classes, masking, or even create and populate new classes. Edits can be saved, discarded, and reviewed in the Edits Log.

Pixel Editor in action

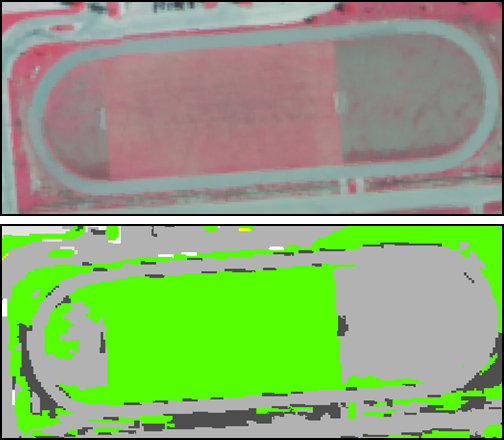
Because the Pixel Editor is contextual, you need to first load the layer you want to edit. Two datasets are loaded into ArcGIS Pro, the infrared source satellite image and the classified result. The source data is infrared satellite imagery where vegetation is depicted in shades of red depending on coverage and relative vigor. This layer has been classified using the Random Trees classifier in ArcGIS Pro. The class map needs editing to account for classification discrepancies and to support operational land use management.

Launch the Pixel Editor

To launch the Pixel Editor, select the classified raster layer in the Contents pane, go to the Imagery tab and click the Pixel Editor button from the Tools group.


The Pixel Editor tab will open. In this example, we’ll be editing a land use map, so the editor will present you with editing tools relevant for thematic data.

The Reclassify dropdown menu

The Region group provides tools for delineating and managing a region of interest. The Edit group provides tools to perform specific operations to reclassify pixels, objects or regions of interest. The Edit group also provides the Operations gallery, which only works on Regions.

Reclassify

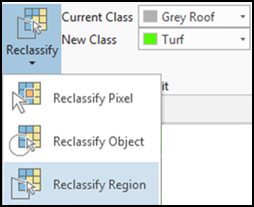
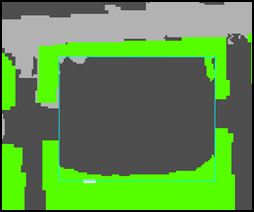
Reclassify is a great tool to reassign a group of pixels to a different class. In the example below, you can see from the multispectral image that either end of the track infield is in poor condition with very little vegetation, which resulted in that portion of the field being incorrectly classified. We want to reclassify these areas as turf, which is colored bright green in the classified dataset.

Infrared image and associated classmap needing edits.

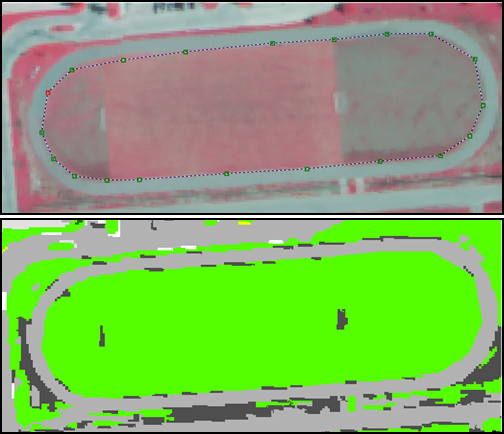
We used the multispectral image as the backdrop to more easily digitize the field, then simply reassigned the incorrect class within the region of interest to the Turf class.

Edited classmap

Majority Filter and Expand
Check out the parking lots south of the track field containing cars, which are undesirable in terms of classified land use. We removed the cars and make the entire parking lot Asphalt with a two-step process:

Parking lot before editing
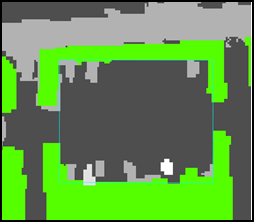
(1) We digitized the parking lot and removed the cars with a Majority Filter operation with a filter size of 20 pixels – the size of the biggest cars in the lot.

(2) Then we used Expand to reclassify any remaining pixels within the lot to Asphalt.

Parking lot after Majority Filter and Expand operations

Add a new class

Another great feature of the Pixel Editor is the ability to add a new class to your classified raster. Here, we added a Water class to account for water features that we missed in the first classification.

Add new class

New class WATER was added to the classmap

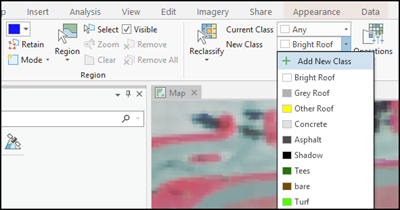
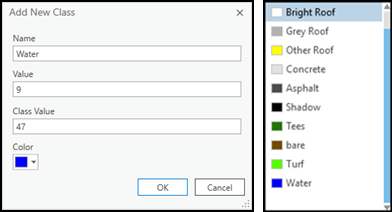
In the New Class drop-down menu, you can add a new class, provide its name, class codes, and define a color for the new class display.

After adding the new class to the class schema, we used the Reclass Object tool to reassign the incorrect Shadow class to the correct Water class. Simply click the object you want to reclassify and encompass it within the circle - and voila! – the object is reclassified to Water.

Reclass incorrect class "Shadow" to correct class "Water"

Feature to Region

Sometimes you may have an existing polygon layer with more accurate class polygon boundaries. These could be building footprints, roads, wetland polygons, water bodies and more. Using the Feature to Region option you can easily create a region of pixels to edit by clicking on the desired feature from your feature layers in the map. Then use the Reclass by Feature tool to assign the proper class.

Region from Feature Edit

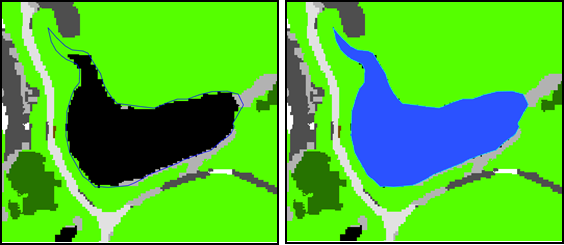
We see the updated water body now matches the polygon feature from your feature class. The class was also changed from Shadow to its correct value, Water.

Summary

The Pixel Editor provides a fast, easy, interactive way to edit your classified rasters. You can edit groups of pixels and objects, and editing operations include reclassification using filtering, expanding and shrinking regions, or by simply selecting or digitizing the areas to reclassify. You can even add an entire new class. Try it out with your own data, and see how quickly you can transform a good classification data set into an effective management tool!

Acknowledgement

Thanks to the co-author, Eric Rice, for his contributions to this article.

more
0 0 633
VinayViswambharan
Esri Contributor

In the aftermath of a natural disaster, response and recovery efforts can be drastically slowed down by manual data collection. Traditionally, insurance assessors and government officials have to rely on human interpretation of imagery and site visits to assess damage and loss. But depending on the scope of a disaster, this necessary process could delay relief to disaster victims.

Article Snapshot: At this year’s Esri User Conference plenary session, the United Services Automobile Association (USAA) demonstrated the use of deep learning capabilities in ArcGIS to perform automated damage assessment of homes after the devastating Woolsey fire. This work was a collaborative prototype between Esri and USAA to show the art of the possible in doing this type of damage assessment using the ArcGIS platform.

The Woolsey Fire burned for 15 days, burning almost 97,000 acres, and damaging or destroying thousands of structures. Deep learning within ArcGIS was used to quickly identify damaged structures within the fire perimeter, fast tracking the time for impacted residents and businesses to have their adjuster process the insurance claims.

The process included capturing training samples, training the deep learning model, running inferencing tools and detecting damaged homes – all done within the ArcGIS platform. In this blog, we’ll walk through each step in the process.

Step1: Managing the imagery

Before the fires were extinguished, DataWing flew drones in the fire perimeter and captured high resolution imagery of impacted areas. The imagery totaled 40 GB in size and was managed using a mosaic dataset. The mosaic dataset is the primary image management model for ArcGIS to manage large volumes of imagery.

Step2. Labelling and preparing training samples

Prior to training a deep learning model, training samples must be created to represent areas of interest – in this case, the USAA was interested in damaged and undamaged buildings. The building footprint data provided by LA County, was overlaid on the high resolution drone imagery in ArcGIS Pro, and several hundred homes were manually labelled as Damaged or Undamaged  (a new field called “ClassValue” in the building footprint feature class was attributed with this information). These training features were used to export training samples using the Export Training Data for Deep Learning tool in ArcGIS Pro, with the metadata output format set to ‘Labeled Tiles’.

                             Resultant image chips (Labeled Tiles used for training the Damage Classification model)
               Resultant image chips (Labeled Tiles used for training the Damage Classification model)

Step 3: Training the deep learning model

ArcGIS Notebooks was used for training purposes. ArcGIS Notebooks is pre-configured with the necessary deep learning libraries, so no extra setup was required. With a few lines of code, the training samples exported from ArcGIS Pro were augmented. Using the arcgis.learn module in the ArcGIS Python API, optimum training parameters for the damage assessment model were set, and the deep learning model was trained using a ResNet34 architecture to classify all buildings in the imagery as either damaged or undamaged.

               
                                       The model converged around 99% accuracy                      

Once complete, the ground truth labels were compared to the model classification results to get a quick qualitative idea on how well the model performed.

         Model Predictions
                                                                           Model Predictions

For complete details on the training process see our post on Medium

Finally, with the model.save() function, the model can be saved and used for inferencing purposes.

Step 4: Running the inferencing tools

Inferencing was performed using the ArcGIS API for Python. By running inferencing inside of ArcGIS Enterprise using the model.classify_features function in Notebooks, we can take the inferencing to scale.

The result is a feature service that can be viewed in ArcGIS Pro. (Here’s a link to the web map).

Over nine thousand buildings were automatically classified using deep learning capabilities within ArcGIS!

The map below shows the damaged buildings marked in red, and the undamaged buildings in green. With 99% accuracy, the model is approaching the performance of a trained adjuster – what used to take us days or weeks, now we can do in a matter of hours.

               Inference results
                                                Inference results

Step 5: Deriving valuable insights

Business Analyst: Now that we had a better understanding of the impacted area, we wanted to understand who were the members impacted by the fires. When deploying mobile response units to disaster areas, it’s important to know where the most at-risk populations are located, for example, the elderly or children. Using Infographics from ArcGIS Business Analyst, we extracted valuable characteristics and information about the impacted community and generated a report to help mobile units make decisions faster.

Get location intelligence with ArcGIS Business Analyst
                                       Get location intelligence with ArcGIS Business Analyst

Operations Dashboard: Using operations dashboard containing enriched feature layers, we created easy dynamic access to the status of any structure, the value of the damaged structures, the affected population and much more.


Summary:

Using deep learning, imagery and data enrichment capabilities in the ArcGIS platform, we can quickly distinguish damaged from undamaged buildings, identify the most at-risk populations, and organizations can use this information for rapid response and recovery activities.

 More Resources:

Deep Learning in ArcGIS Pro

Distributed Processing using Raster Analytics

Image Analysis Workflows

Details on the model training of the damage assessment 

ArcGIS Notebooks

ABOUT THE AUTHORS

Vinay Viswambharan

Product manager on the Imagery team at Esri, with a zeal for remote sensing and everything imagery.

Rohit Singh

Development Lead - ArcGIS API for Python. Applying deep learning to the Science of Where @Esri. https://twitter.com/geonumist

more
1 0 2,364
by Anonymous User
Not applicable

The new Getting to Know ArcGIS Image Analyst guide gives GIS professionals and imagery analysts hands-on experience with the functionality available with the ArcGIS Image Analyst extension.

It’s a complete training guide to help you get started with complex image processing workflows. It includes a checklist of tutorials, videos and lessons along with links to additional help topics.

Task Checklist for getting started with ArcGIS Image Analyst

This guide is useful to anyone interested in learning how to work with the powerful image processing and visualization capabilities available with the ArcGIS Image Analyst. Complete the checklist provided in the guide and you’ll get hands on experience with:

  • Setting up ArcGIS Image Analyst in ArcGIS Pro
  • Extracting features from imagery using machine learning image classification and deep learning methods
  • Processing imagery quickly using raster functions
  • Visualizing and creating data in a stereo map
  • Creating and measuring features in image space
  • Working with Full Motion Video

Download the guide and let us know what you think! Take the guide survey to provide us with direct feedback.

ABOUT THE AUTHOR

more
2 0 783
by Anonymous User
Not applicable

Did you know there is a huge repository of powerful Python Raster Functions that you can use for raster analysis and visualization? On the Esri/raster-functions repository on GitHub, you can browse, download, and utilize customized raster functions for on-the-fly processing on your desktop or in the cloud.

Esri's raster functions GitHub repository

What are Python raster functions, you ask?

A raster function is a sneaky way to perform complex raster analysis and visualization without taking up more space on your disk or more time in your day, with on-the-fly processing. A single raster function performs an analysis on an input raster, then displays the result on your screen. No new dataset is created, and pixels get processed as you pan and zoom around the image. You can connect multiple raster functions in a raster function chain and you can turn it into a raster function template by setting parameters as variables.

A Python raster function is simply a custom raster function. A lot of raster functions come with ArcGIS out-of-the-box, but if you don’t find what you’re looking for or you want to create something specific to your needs, you can script your own with Python.

There are a lot of Python raster functions already written and posted for everyone to use, and they’re easy to download and use in ArcGIS. And some of them are unbelievably cool.

For example: Topographic Correction function

The Topographic C Correction function, written by Gregory Brunner from the St. Louis Regional Services office, essentially removes the hillshade from orthophotos. As you can imagine, imagery over mountainous areas or regions with rugged terrain can be difficult to classify accurately because pixels may belong to the same land cover class but some fall into shadow due to varying slopes and aspects. With the topographic correction function, you can get a better estimate of pixel values that would otherwise be impacted by hillshade. The result is a sort of flattening of the image, and it involves some fairly complex math.

Hillshade removal effect

Why should you care?

Okay, so now you know there’s a repository of Python raster functions. What’s next?

  1. Explore the functions you may need.
    Some of the functions on the repository were written for specialized purposes and aren’t included with the ArcGIS installation, such as the Topographic C Correctionfunction (above) or the Linear Spectral Unmixing function [contributed by Jacob Wasilkowski, also from the St. Louis Esri Regional office].
  2. Try writing your own Python raster function.
    A lot of what’s on the GitHub repository is already in the list of out-of-the-box raster functions, but you can open the Python scripts associated with each one, customize them, and save them as new Python raster functions. This can be a great learning tool for those new to the process.
  3. Watch the repo for more functions.
    There are currently over 40 functions listed, and we are continually adding more.
  4. Contribute!
    Have you written something that you can share with the broader community? Do you have ideas for cool raster functions? Add to the conversation by commenting below!


Get Started

To easily access all the Python Raster Functions in the GitHub repository, simply click the Clone or Download button on the repository code page, and choose to download the raster functions as a ZIP file.

Click download ZIP button to get the full repo

Extract the zip folder to your disk, then use this helpful Wiki to read about using the Python Raster Functions in ArcGIS Pro.

For an example tutorial on using the Python Raster Functions, check out the blog on the Aspect-Slope function.


Enjoy exploring!

more
3 0 1,160
JeffLiedtke
Esri Contributor

ArcGIS Enterprise configured for Raster Analytics enables large and small organizations to distribute and scale raster processing, storage and sharing to meet requirements for unique projects. This flexibility and elasticity also allows you to pursue projects that were previously out of reach due to hardware, software, personnel, or cost constraints. An overview of Raster Analytics concepts and advantages is described in the article Imagery Superpowers – Raster analytics expands imagery use in GIS.

Raster Analytics Processing Workflow

To help you become familiar with the benefits of Raster Analytics, Esri is offering a new Learn Lesson for ArcGIS Enterprise users. The lesson guides you through the process of configuring your Enterprise system for Raster Analytics, shows you how to use raster processing tools and functions to assess potential landslide risk associated with wildfire. The analysis is run on your distributed processing system, and the results are published to your Enterprise portal for ease of sharing across your organization. The lesson is a practical guide for implementing a Raster Analytics deployment, and demonstrating how standard ArcGIS Pro tools and functionality can be used to run distributed processes behind your firewall and in the cloud, and shared with stakeholders across your enterprise. Check out this story map, which gives you a more detailed overview of what the lesson involves.

Drag and drop tools into the function editor to create raster function chains.

Ready to try it out? If you want to extend your capabilities with Raster Analytics for increased productivity, test out the lesson and see why users are excited about the opportunity to address demanding projects in a more effective and efficient manner.

Many Thanks to Katy Nesbitt (knesbitt@esri.com) for co-authoring this article.

more
0 0 637
176 Subscribers