- Home
- :
- All Communities
- :
- Developers
- :
- Python
- :
- Python Blog
- :
- Numpy Snippets # 2 .... array to table and back ag...
Numpy Snippets # 2 .... array to table and back again ...
- Subscribe to RSS Feed
- Mark as New
- Mark as Read
- Bookmark
- Subscribe
- Printer Friendly Page
- Report Inappropriate Content
Numpy Snippets
Updates: 2016-09-09
This just a quick example of how to use existing arrays and export them to tables. In this case I will use arcpy functionality to produce a dBase file. Numpy can be used directly to produce text files as well.
To begin with:
- two arrays of X and Y values are created in the range 0-10 inclusive (ie 11 numbers),
- a data type is specified (dt)... in this case I assigned 'X' and 'Y' to the columns and specified a 64-bit floating point number,
- an array, XY, is create using some fancy zipping of the original arrays with the specified data type,
- ArcPy is imported, an output table is created using the data access module's NumPyArrayToTable.
- Now for the magical reveal
>>> import numpy as np
>>> X = np.arange(11) # take some numbers
>>> Y = np.arange(11) # ditto
>>> dt = [('X','<f8'),('Y','<f8')] # specify a data type ie 64 bit floats
>>>
>>> XY = np.array(zip(X,Y), dtype = dt) # create a 2D array of floats
>>> XY
array([(0.0, 0.0), (1.0, 1.0), (2.0, 2.0), (3.0, 3.0), (4.0, 4.0),
(5.0, 5.0), (6.0, 6.0), (7.0, 7.0), (8.0, 8.0), (9.0, 9.0),
(10.0, 10.0)],
dtype=[('X', '<f8'), ('Y', '<f8')])
>>>
>>> import arcpy # now lets do some arcpy stuff
>>> out_table = 'c:/temp/test.dbf'
>>> arcpy.da.NumPyArrayToTable(XY,out_table)
: -----------------------------------------------------
Now for the reveal...
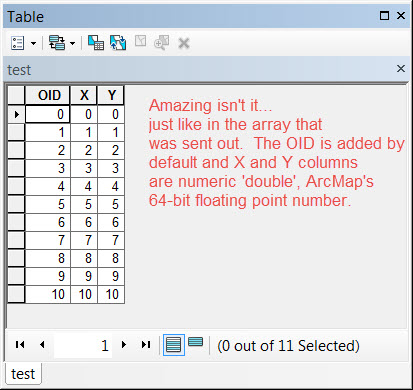
: -----------------------------------------------------
Bring it back you say? Nothing could be easier.
>>> in_array = arcpy.da.TableToNumPyArray(out_table,['OID','X','Y'])
>>> in_array
array([(0, 0.0, 0.0), (1, 1.0, 1.0), (2, 2.0, 2.0), (3, 3.0, 3.0),
(4, 4.0, 4.0), (5, 5.0, 5.0), (6, 6.0, 6.0), (7, 7.0, 7.0),
(8, 8.0, 8.0), (9, 9.0, 9.0), (10, 10.0, 10.0)],
dtype=[('OID', '<i4'), ('X', '<f8'), ('Y', '<f8')])
: -----------------------------------------------------
Out to *.csv you say? Too easy (nothing fancy this time...just the numbers but formatted a bit).
0, 0.00, 0.00
1, 1.00, 1.00
2, 2.00, 2.00
3, 3.00, 3.00
4, 4.00, 4.00
5, 5.00, 5.00
6, 6.00, 6.00
7, 7.00, 7.00
8, 8.00, 8.00
9, 9.00, 9.00
10, 10.00, 10.00
So NumPy and ArcPy do play 'nice' together. Experiment a bit. More later.
You must be a registered user to add a comment. If you've already registered, sign in. Otherwise, register and sign in.