- Subscribe to RSS Feed
- Mark as New
- Mark as Read
- Bookmark
- Subscribe
- Printer Friendly Page
- Report Inappropriate Content
Connecting the dots. Spanning trees have a wide variety of applications in GIS... or did. I have been finishing writings on distance and geometry and I almost forgot this one. The principle is simple. Connect the dots, so that no line (edge) overlaps, but only connects at a point. In practice, you want the tree to produce a minimal length/distance output. There are a variety of names forms, each with their subtle nuance and application, but my favorite is Prim's... only because I sortof understand it. I am not sure if this his implementation exactly, but it is close enough. So I post it here for those that want to try it. Besides, Prim's can be used to produce mazes, a far more useful application of dot connection.
My favorite code header to cover imports and array printing and some bare-bones graphing
import sys
import numpy as np
import matplotlib.pyplot as plt
from textwrap import dedent, indent
ft = {'bool': lambda x: repr(x.astype('int32')),
'float': '{: 0.1f}'.format}
np.set_printoptions(edgeitems=10, linewidth=100, precision=2,
suppress=True, threshold=120,
formatter=ft)
np.ma.masked_print_option.set_display('-')
script = sys.argv[0]Now the ending of the script where the actual calls are performed and an explanation of what is happening occurs.
# ---------------------------------------------------------------------
if __name__ == "__main__":
"""Main section... """
#print("Script... {}".format(script))
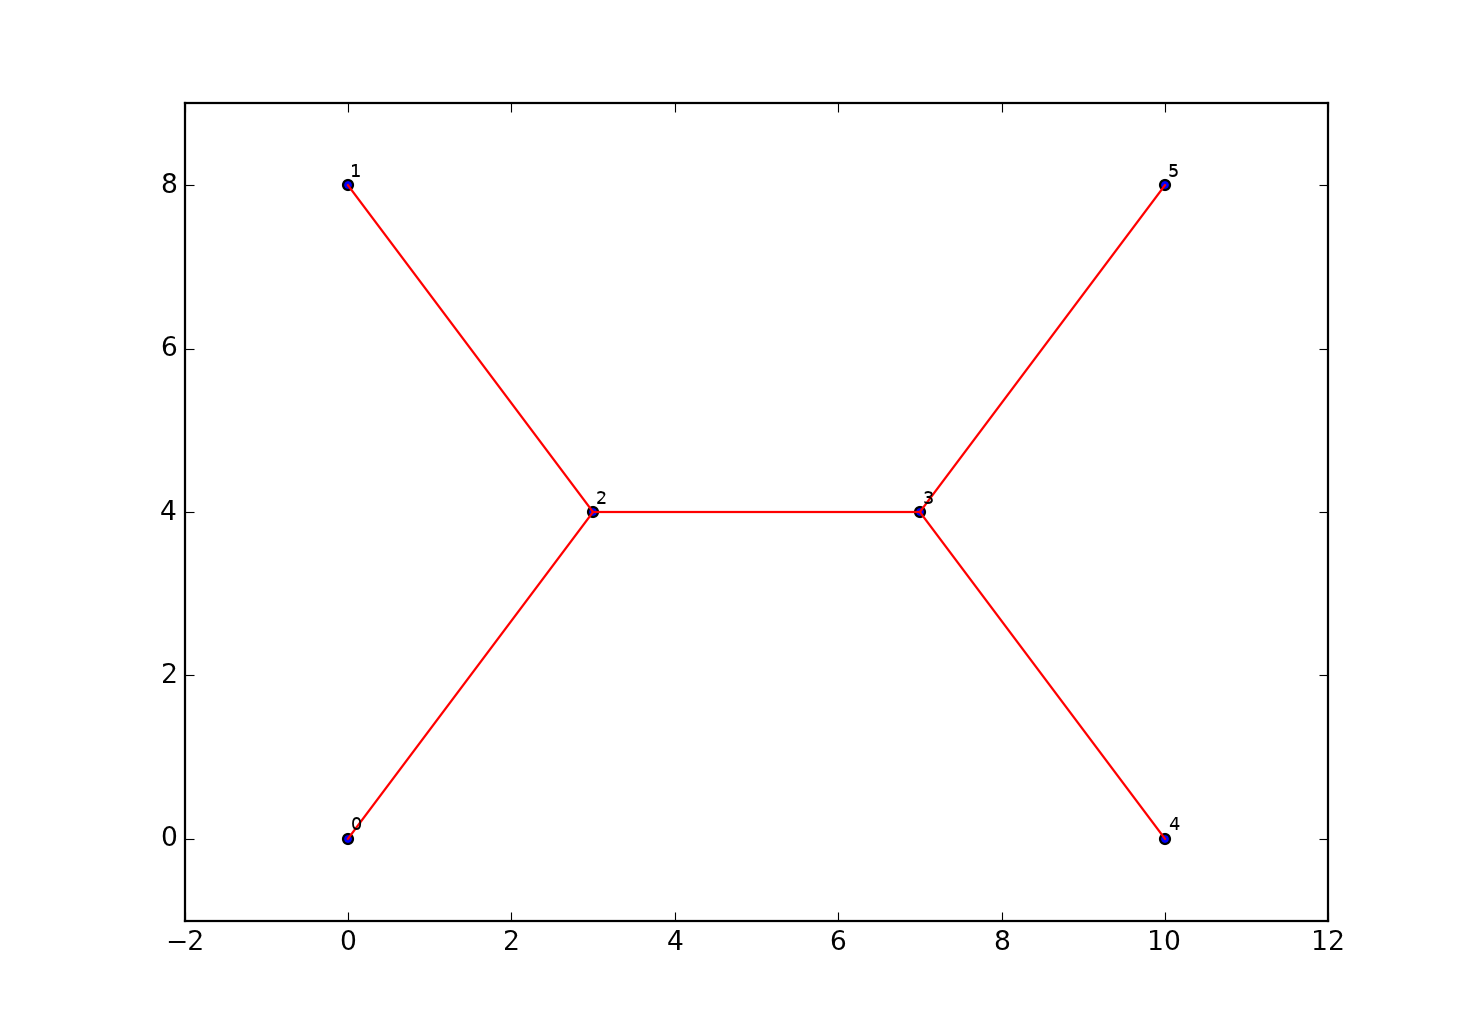
# ---- Take a few points to get you started ----
a = np.array([[0, 0], [0,8], [10, 8], [10,0], [3, 4], [7,4]])
#
idx= np.lexsort((a[:,1], a[:,0])) # sort X, then Y
a_srt = a[idx,:] # slice the sorted array
d = _e_dist(a_srt) # determine the square form distances
pairs = mst(d) # get the orig-dest pairs for the mst
plot_mst(a_srt, pairs) # a little plot
o_d = connect(a_srt, d, pairs) # produce an o-d structured arrayNow the rest is just filler. The code defs are given below.
def _e_dist(a):
"""Return a 2D square-form euclidean distance matrix. For other
: dimensions, use e_dist in ein_geom.py"""
b = a.reshape(np.prod(a.shape[:-1]), 1, a.shape[-1])
diff = a - b
d = np.sqrt(np.einsum('ijk,ijk->ij', diff, diff)).squeeze()
#d = np.triu(d)
return d
def mst(W, copy_W=True):
"""Determine the minimum spanning tree for a set of points represented
: by their inter-point distances... ie their 'W'eights
:Requires:
:--------
: W - edge weights (distance, time) for a set of points. W needs to be
: a square array or a np.triu perhaps
:Returns:
:-------
: pairs - the pair of nodes that form the edges
"""
if copy_W:
W = W.copy()
if W.shape[0] != W.shape[1]:
raise ValueError("W needs to be square matrix of edge weights")
Np = W.shape[0]
pairs = []
pnts_seen = [0] # Add the first point
n_seen = 1
# exclude self connections by assigning inf to the diagonal
diag = np.arange(Np)
W[diag, diag] = np.inf
#
while n_seen != Np:
new_edge = np.argmin(W[pnts_seen], axis=None)
new_edge = divmod(new_edge, Np)
new_edge = [pnts_seen[new_edge[0]], new_edge[1]]
pairs.append(new_edge)
pnts_seen.append(new_edge[1])
W[pnts_seen, new_edge[1]] = np.inf
W[new_edge[1], pnts_seen] = np.inf
n_seen += 1
return np.vstack(pairs)
def plot_mst(a, pairs):
"""plot minimum spanning tree test """
plt.scatter(a[:, 0], a[:, 1])
ax = plt.axes()
ax.set_aspect('equal')
for pair in pairs:
i, j = pair
plt.plot([a[i, 0], a[j, 0]], [a[i, 1], a[j, 1]], c='r')
lbl = np.arange(len(a))
for label, xpt, ypt in zip(lbl, a[:,0], a[:,1]):
plt.annotate(label, xy=(xpt, ypt), xytext=(2,2), size=8,
textcoords='offset points',
ha='left', va='bottom')
plt.show()
plt.close()
def connect(a, dist_arr, edges):
"""Return the full spanning tree, with points, connections and distance
: a - point array
: dist - distance array, from _e_dist
: edge - edges, from mst
"""
p_f = edges[:, 0]
p_t = edges[:, 1]
d = dist_arr[p_f, p_t]
n = p_f.shape[0]
dt = [('Orig', '<i4'), ('Dest', 'i4'), ('Dist', '<f8')]
out = np.zeros((n,), dtype=dt)
out['Orig'] = p_f
out['Dest'] = p_t
out['Dist'] = d
return outThe output from the sample points is hardly exciting. But you can see the possibilities for the other set.
This one is for a 100 points, with a minimum spacing of 3 within a 100x100 unit square. Sprightly solution even on an iThingy using python 3.5
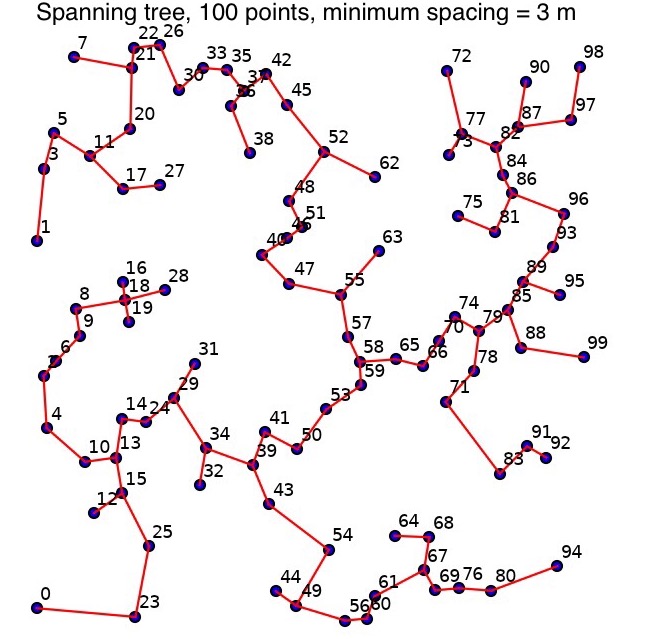
Now on to maze creation .....
You must be a registered user to add a comment. If you've already registered, sign in. Otherwise, register and sign in.