3D Blog

cancel
Showing results for 
Show  only  | Search instead for 
Did you mean: 

Other Boards in This Place

Latest Activity

(40 Posts)
Gert_van_Maren
Esri Contributor

The 3D basemaps solution can be used by mapping technicians to create and maintain a 3D basemap for their organization, leveraging existing data such as lidar, building footprints, meshes and underground utility features.

The February 2021 release of the 3D basemaps solution has some great enhancements:

  • Mesh support
  • Ability to color trees in lidar point clouds.
Read more...

more
0 0 1,152
Gert_van_Maren
Esri Contributor

The November 2020 release sees the first integration of deep learning into the 3D basemaps solution. Leveraging the new tree classification deep learning model on the Living Atlas, it is now possible to classify trees in lidar point clouds and more accurately extract tree location, height and width.

Read more...

more
2 8 2,667
CristofferMalm
New Contributor II

The ArcGIS Analysis and 3D-Visualization for fictional 5G network planning is a Web Mapping Application that helps you locate ultimate spots for, as in this demo, new 5G Networks. In urban areas, there are limited locations available for implementation of new infrastructure, which makes it vital to be aware of your surroundings before planning a new network. In this post you will be guided through the application and see the possibilities with ArcGIS Analysis and 3D-Visualization for identifying a suitable location for implementation of a new 5G cell network. The demo for interaction with the application is found here

What is Possible With ArcGIS Analysis and 3D-Visualization?

There are several tools that are useful with this 3D application. Terrain, viewshed, position of current towers such as traffic lights and cell towers, are features that can help you to find suitable locations for new infrastructure and to make you accommodated with the surrounding areas, both on street level and from above. 


Current Landscape Features

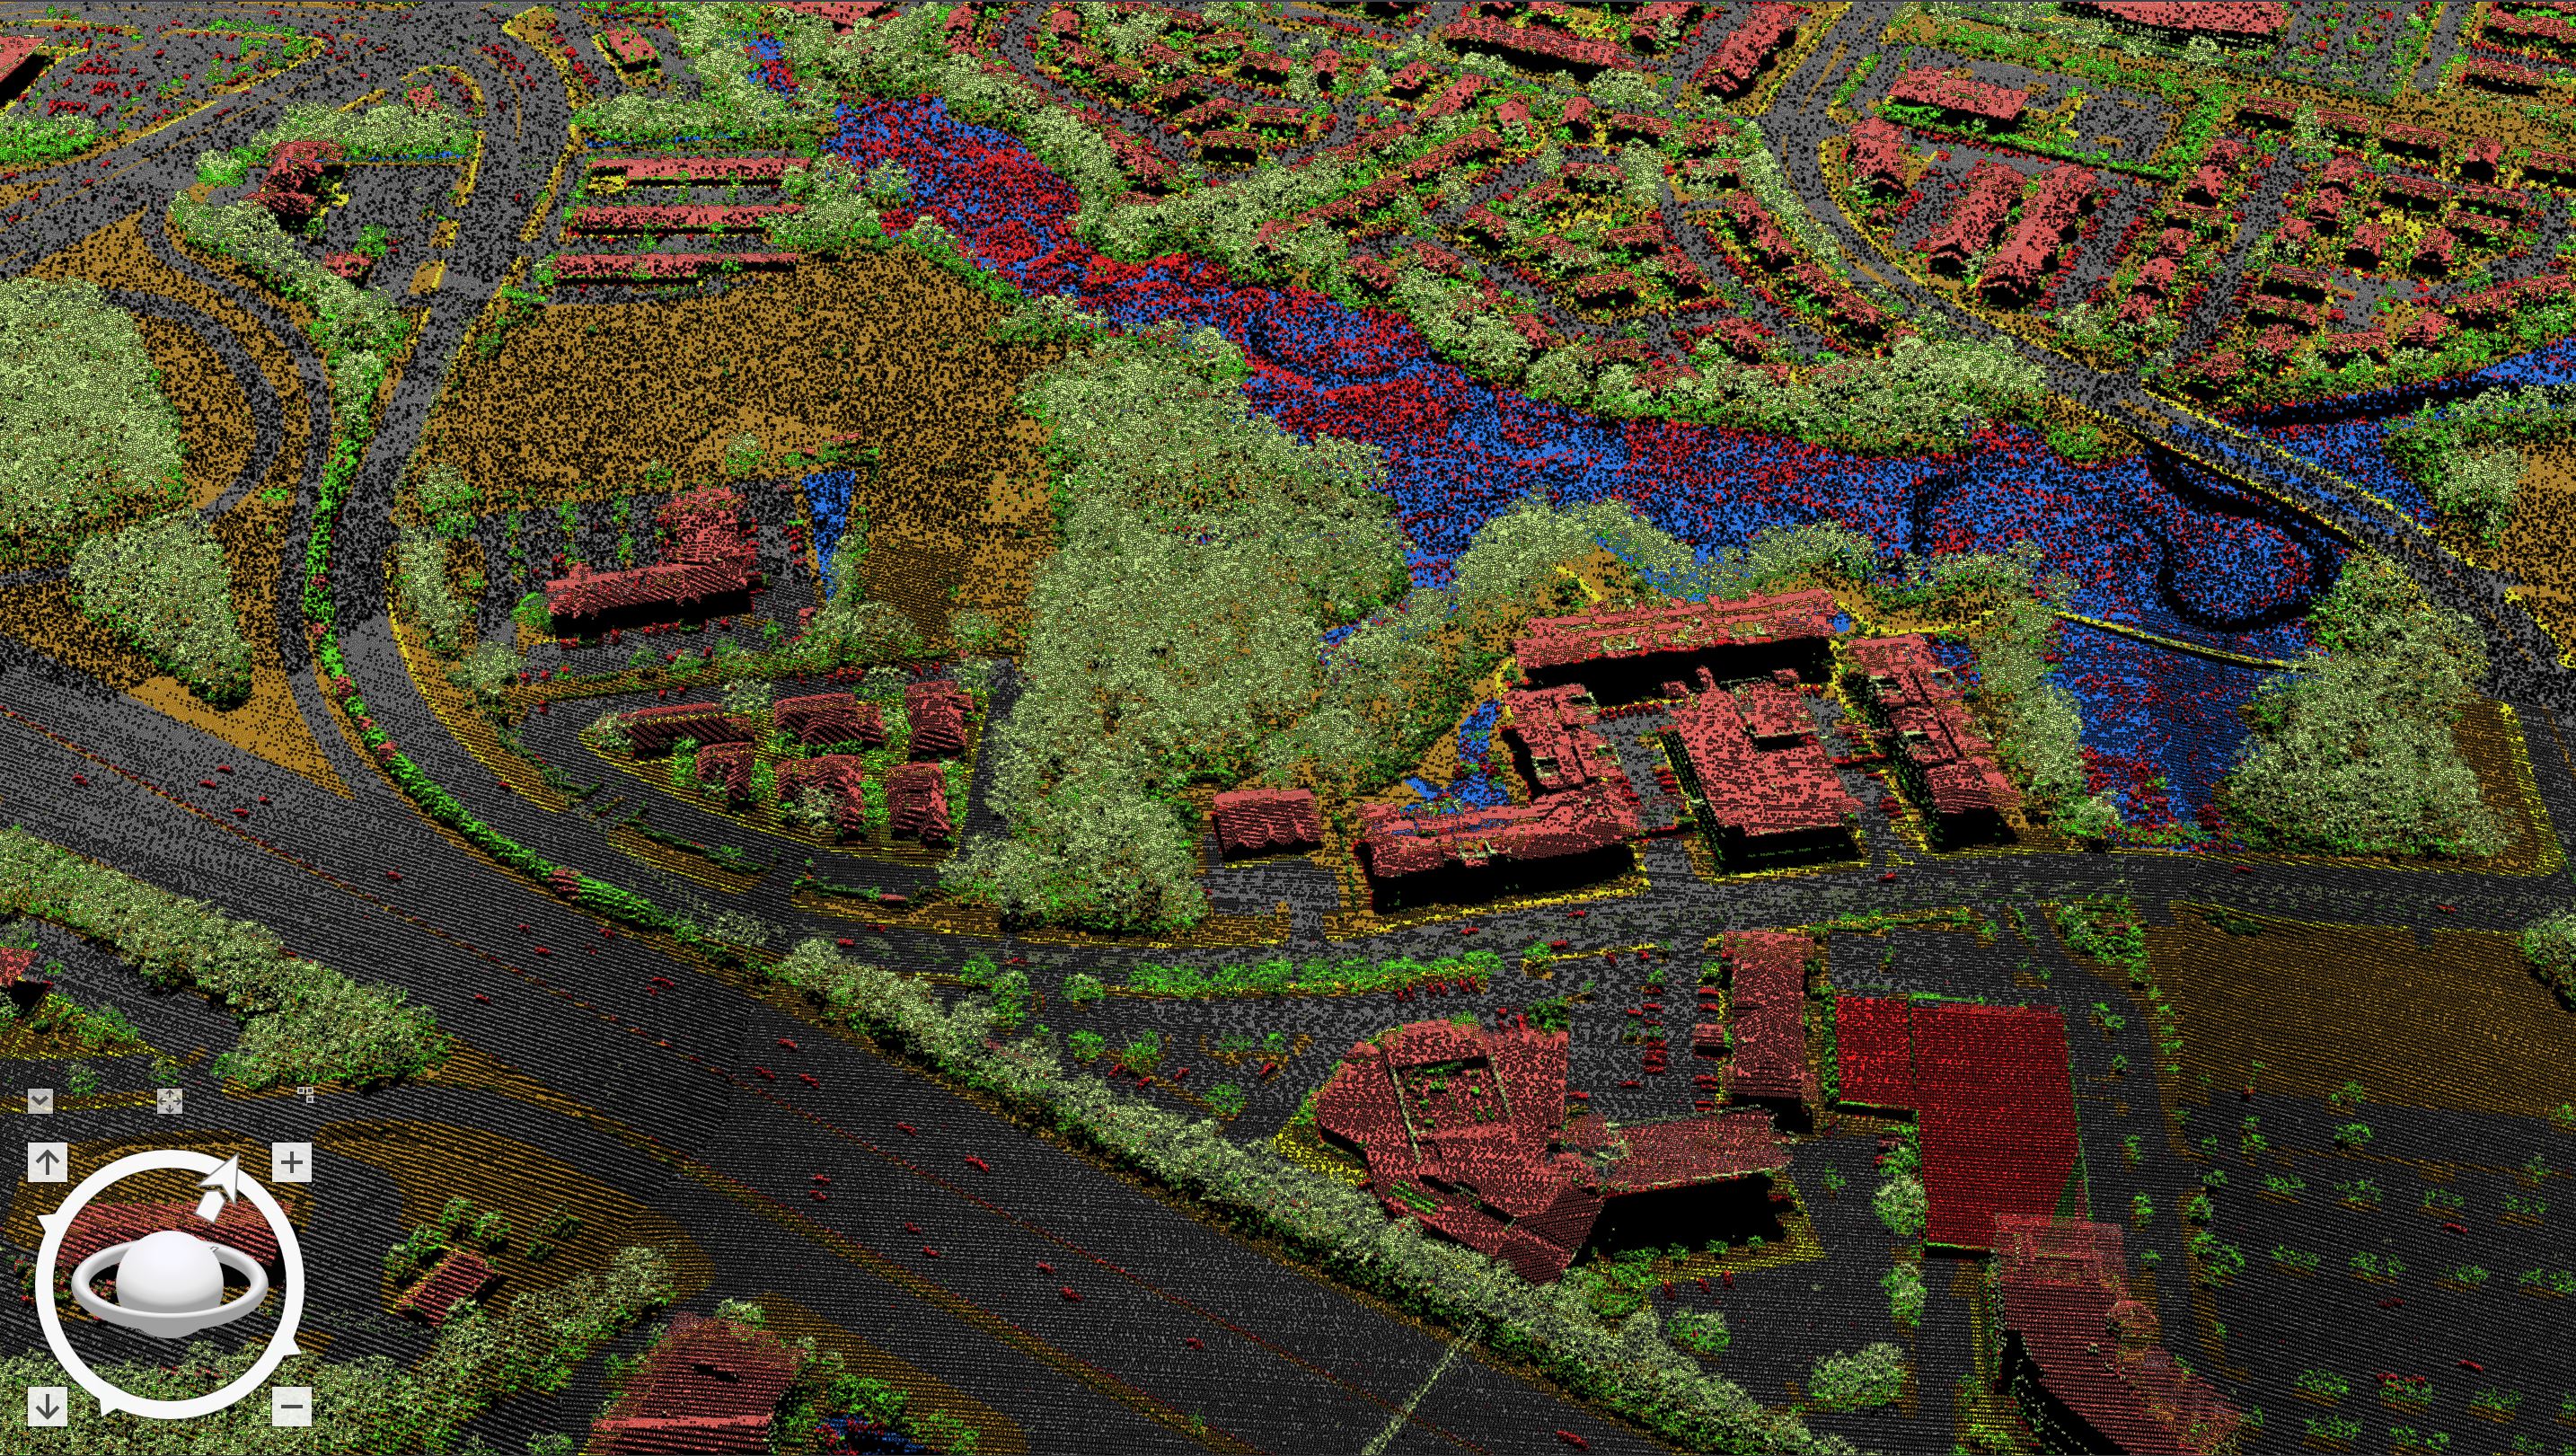
The Analysis and 3D-Visualization can illustrate how and where the current fiber networks are distributed and how they are arranged in the specific site. This, together with the visualization of current buildings, terrain, and viewshed, you can set the criteria for where you should install your 5G mast. 


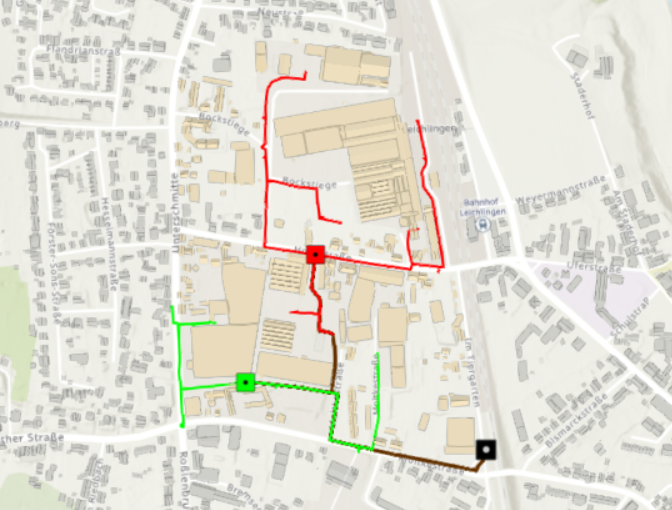
With ArcGIS Network and 3D-Visualization, you can see where current underground networks are places, such as fiber (shown in photo). Listed in the legend (picture to the left) are a few of the features found in the demo.

Street Level View

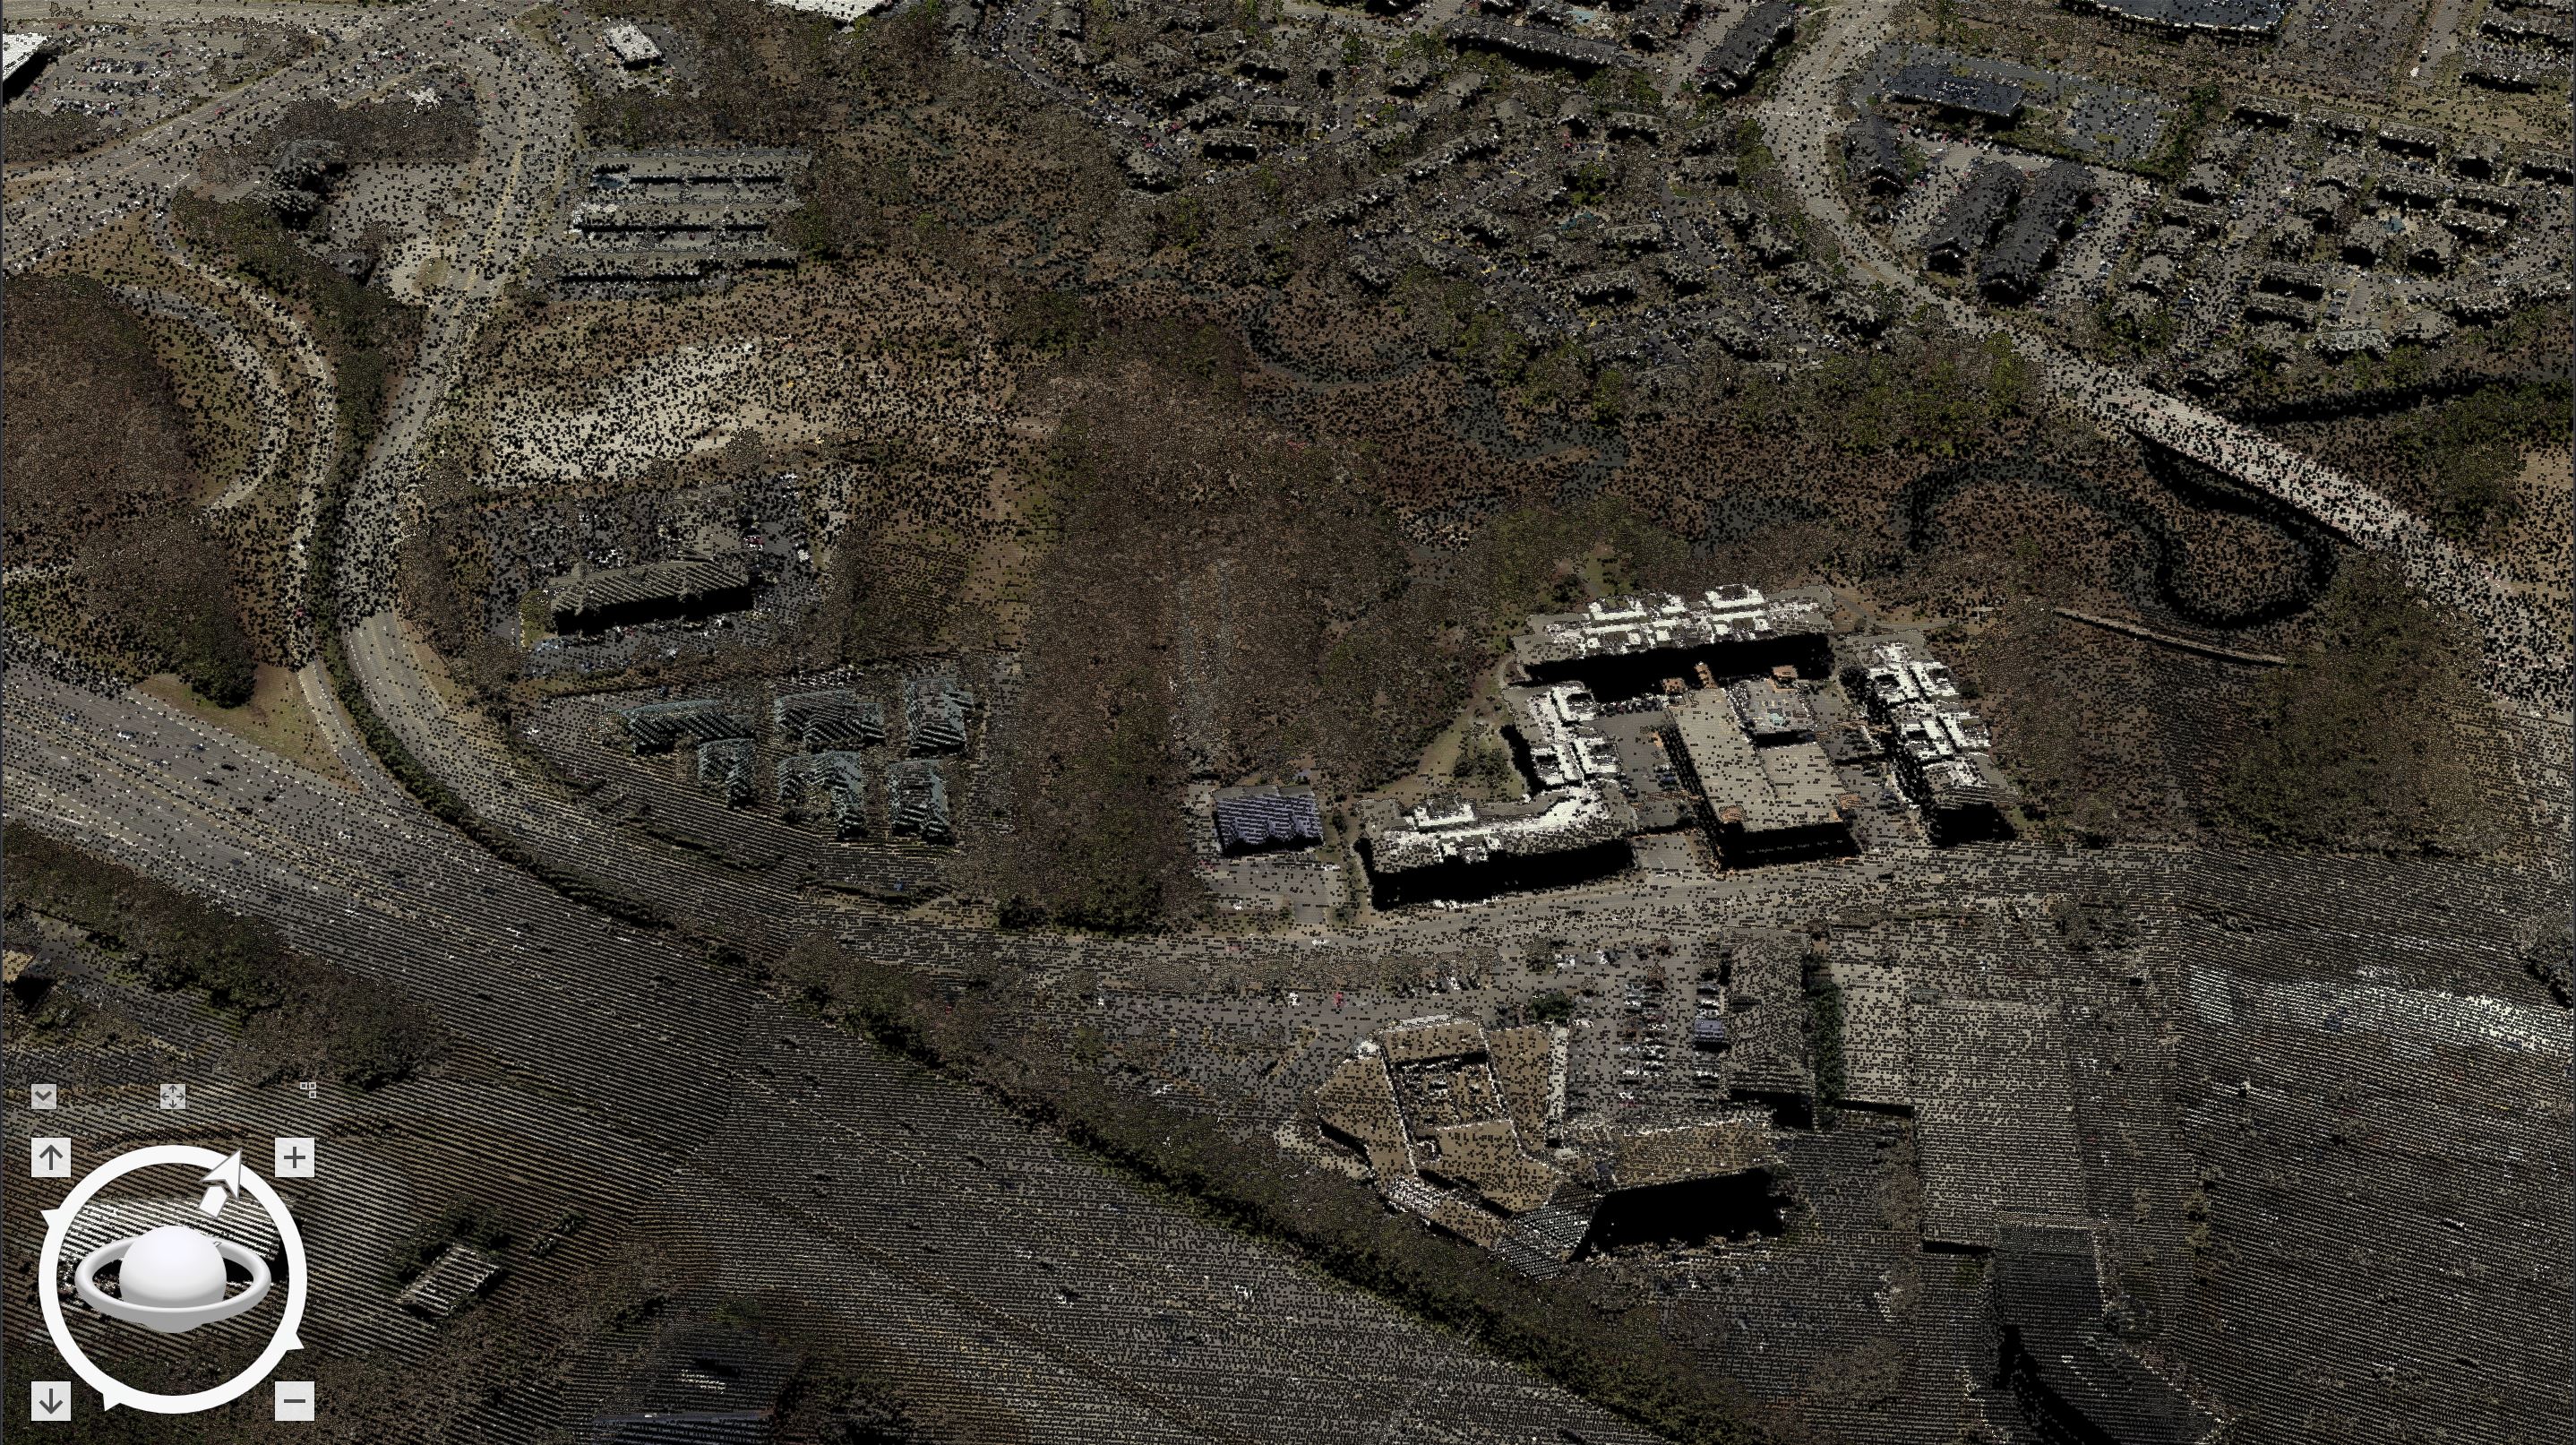
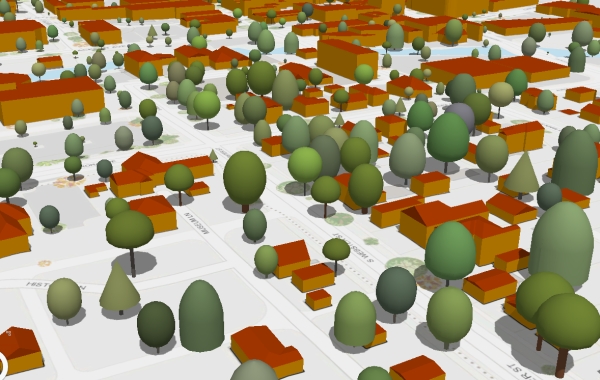
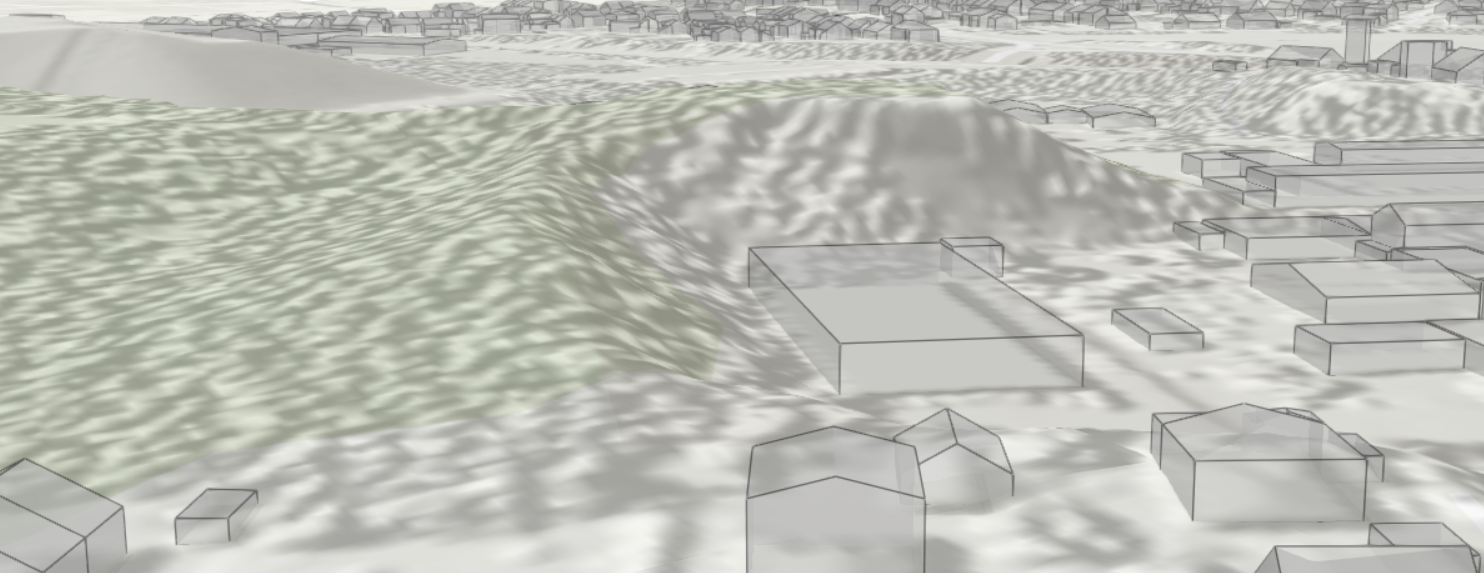
Another great feature is the possibility to 'walk around’ on ground level to get a closer look of the site and its features. This tool allows you to visualize details of the existing building's structure, terrain, and also the vegetation and viewshed, which will be discussed further down. With the possibility to change bookmarks, you can also view in satellite photo for a more detailed and realistic experience.

        The picture above illustrates the view from street level, where the building structure and height becomes apparent.

Viewshed Tool

Cities with varying topology can benefit from the viewshed tool in Analysis and 3D-Visualization application. With the viewshed tool, you can get an accurate picture of what features that are in line-of-sight from a specific viewpoint, and which obstacles that are in the way of a clear sight. In context with cell tower implementation, this solution makes it possible to avoid environmental impact of an area or if the visibility impacts the city's look negatively. The program offers viewshed for traffic lights, current cell towers, street lamps, and more.


The picture shows the visibility of specific features in an area, in this case it shows where and how far you can see the traffic light that is located in the middle of the picture.


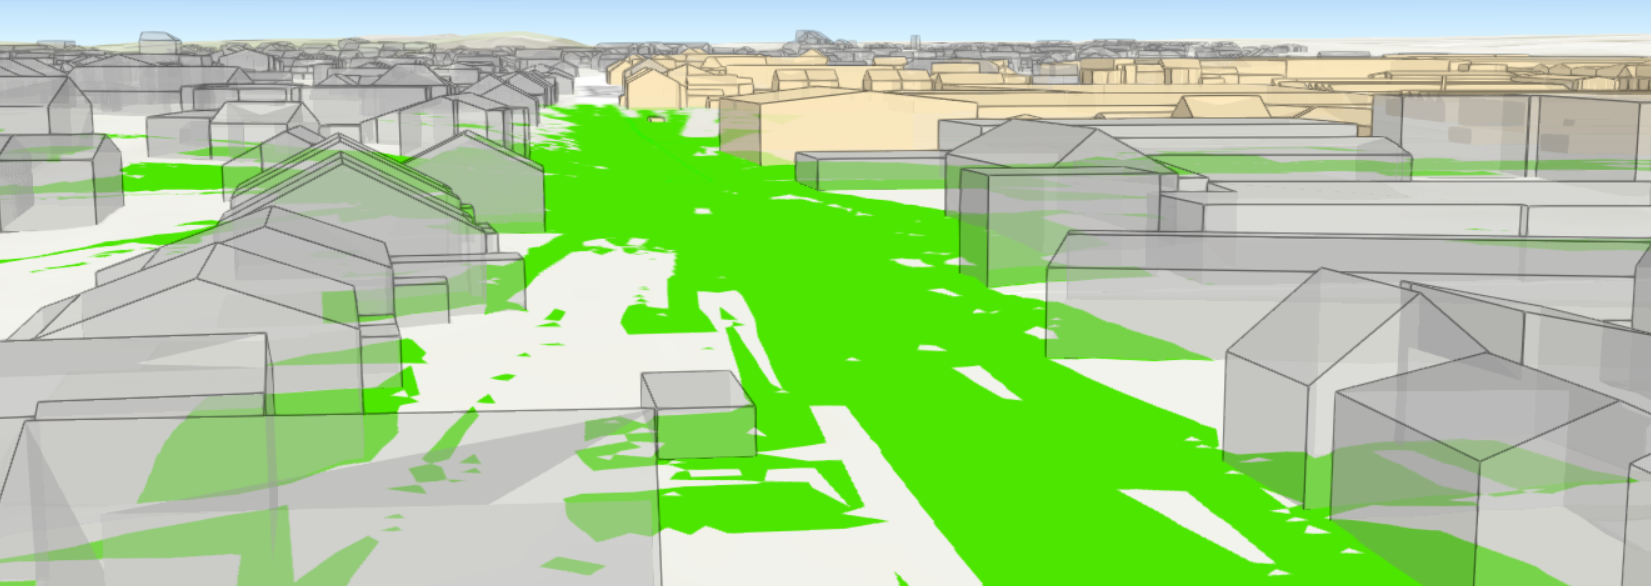
The picture above shows the geographical area that is visible from                                                            The picture above shows the terrain in a specific area,         a specific point, in this case a traffic light in the center of the picture.                                                                  and where the nearby buildings are located. 


Bookmarks 

The use of different bookmarks let you decide which illustration that is optimal for your project. These bookmark include satellite images, focus on infrastructure, and viewshed from all available points in the same bookmark. Depending on your preference, you can view from satellite viewpoint to see the full areas viewshed from a certain point, or you can go into detail and see exact locations of features such as buildings and current cell towers. The seventh layer from left is designed for improvement of mobile network (campuses)..

There are also several base map alternatives, for example a base map with navigation focus, or one with focus on street networks. 


Summary 

  • The ArcGIS Analysis and 3D-Visualization helps you locate ultimate spots for new infrastructure

  • There are several tools available for you to investigate the areas terrain, viewshed, and position of current towers such as traffic lights and cell towers
  • The possibility to view the area on street level helps you to see it more detailed
  • The terrain view illustrates the topology and gives you and accurate 3D-image, which is useful for the viewshed from different points of the area
  • The bookmarks give you an option of focusing on details, or on the viewshed distribution from different points

more
2 0 1,489
by Anonymous User
Not applicable

Hello and welcome the the Scene Layers section of the 3D GIS Showcase!

Even thought we're virtual, we'll make sure to answer all your questions and provide you with guidance for utilizing 3D Scene Layers.  If you're new to Scene Layers, it's the mechanism that we use to stream large volumes of 3D GIS content over the web that can be consumed by Scene Viewer, Earth, ArcGIS Pro and other clients.  This enables beautiful and performant 3D experiences that help solve real problems.

We encourage you to chat or schedule meetings with us to ask questions and provide feedback that will guide our roadmap moving forward.   

ucRelevant links:

What is a Scene Layer?

Esri I3S Specifications

Editing Scene Layers

Authoring 3D Layers and Creating Web Scene in ArcGIS Online

What's New in Scene Viewer, June 2020

Storymap:  What's New in Scene Viewer 2020

Don't miss these sessions! 

3D Across ArcGIS

CAD: Using BIM Data from Revit in ArcGIS Pro

3D on the Web with ArcGIS

ArcGIS API for JavaScript: 3D Visualization

A Deep Dive into 3D Analysis Options

Creating and Visualizing Voxel Layers in ArcGIS

more
0 0 962
Gert_van_Maren
Esri Contributor

Today we released our new 3D basemaps solution. This solution includes a series of workflows that can be used by mapping technicians to create and maintain a 3D basemap for their organization, leveraging existing data such as lidar, building footprints and underground utility features. The output of the workflows is a collection of 3D layers which can be used to serve as a 3D basemap for desktop, mobile and web mapping applications.

3D basemap generated from lidar

Leveraging lidar to create a 3D basemap.

This new release is a major enhancement of the existing local government 3D basemaps solution which has been moved to mature support. New in the 3D basemaps solution is the ability to:

  • create 3D bridges using classified lidar and procedural rules 
  • create 3D power lines using existing GIS data such as power pole locations
  • create underground pipes from existing utility data

We also improved the task workflows and structured them around a layer based output. For more information, check out the "Getting to know 3D basemaps" storymap or visit the ArcGIS Solutions website

more
6 49 11.3K
Gert_van_Maren
Esri Contributor

The February 2020 release of the Local Government 3D basemap solution offers some new exciting functionality. Leveraging improved geo-processing tools in ArcGIS Pro 2.5, it is now possible to extract high quality building footprints from your lidar which in turn can be used to generate 3D buildings with roof forms.

With this new capability, the Local Government 3D Basemap solution now only requires lidar as input to generate a 3D basemap with 3D buildings, 3D trees, building footprints and detailed elevation surfaces. For best results, buildings need to be classified in the lidar and the quality of the resulting footprints and 3D buildings is dependent on the point density of your lidar. 

Download your copy of the solution here:

Local Government 3D Basemaps | ArcGIS Solutions for Local Government 

More information on the footprint extraction from lidar can be found here:

Building Footprint extraction - Local Government 3D Basemaps | ArcGIS Solutions for Local Government 

more
0 3 3,087
by Anonymous User
Not applicable

Due to popular demand the Leveraging LiDAR Template is finally here. 

Whether you are working for a government agency, AEC company, or hobbyist collecting data via drone or plane this Task-Based workflow for ArcGIS Pro 2.4 goes step-by-step through.

  1. LiDAR Preparation for ArcGIS Pro
  2. LiDAR Classification, Colorization, Dissemination (Sharing Online or on ArcGIS Enterprise)
  3. LiDAR Surface and Elevation Raster Tile Generation 
  4. LiDAR DEM Raster Tile Generation 
  5. DEM elevation caching and publishing for ArcGIS Online & ArcGIS Enterprise
  6. Building Footprint Extraction
  7. Initial intro to tools leveraged in the Local Government 3D Scenes Solution.
    1. The Tiled Raster data and raster data generated in this process can be leveraged in the 3D Scene Solution here: solutions.arcgis.com/local-government/help/local-government-scenes/

LiDAR Classified

Additional Credit to Arthur Crawford for developing steps within this process.

You can download the template here: https://esriis-my.sharepoint.com/:f:/g/personal/geof7015_esri_com/EpaUfp7SzpZAuc6lynMzCEcBqP-QOoRCQj... 

Please provide comments below or contact me at gtaylor@esri.com concerning issues/questions.

Cheers!

Geoff

more
5 0 2,793
Gert_van_Maren
Esri Contributor

What are the 3D Tools for Power lines?

The 3D Tools for Power lines solution is a collection of ArcGIS Pro tools that simplifies and automates the process of creating 3D visualizations of transmission and distribution lines. The results can be published and visualized in a 3D scene which can be easily shared with stakeholders or the public.


Benefits

The following are some benefits of using 3D Tools for Power lines:

  • Visualize existing power lines in 3D and add them to your 3D basemap to serve as a foundation for creating 3D applications and workflows.
  • Visualize proposed power lines in 3D and assess the visual impact on the surrounding landscape.
  • Supports both transmission and distribution lines
  • Works with existing GIS data as input.
  • Creates realistic 3D representations of conductor and tower structures
  • Supports a wide variety of conductor and tower configurations

Austin Power line scene

Get started with 3D Tools for Power lines

  • Download the 3D Tools for Power lines ArcGIS Pro project.
  • Read the current limitations in the description. 
  • Extract the zip file to a folder on your machine.
  • Open the 3DToolsForPowerLines.aprx in ArcGIS Pro.
  • In the Catalog pane, expand the Tasks folder, then double-click on the Create 3D Power Lines task
  • Use the Create 3D Power Lines task to step through the workflow.


System requirements

The following software is required:

  • ArcGIS Pro 2.3 - 2.4 (Advanced)
  • ArcGIS 3D Analyst extension

Note: you might need to install the Microsoft Access Database Engine driver if you encounter a TableToTable error. See this link: https://pro.arcgis.com/en/pro-app/help/data/excel/work-with-excel-in-arcgis-pro.htm

Feedback

It would be helpful for us to know:

  • how these workflows and apps will benefit your organization
  • how the workflows and apps can be improved
  • any bugs or other issues.


For comments, questions, bug reports, new requirements: please email gvanmaren@esri.com

more
6 10 6,366
Gert_van_Maren
Esri Contributor

What is the Flood Impact Analysis solution?

The Flood Impact Analysis solution can be used to develop flooding scenarios and visualize the impact on the existing landscape. It leverages flood depth data to analyze the impact of flood events on critical assets such as buildings, bridges, low water crossings and roads.  It also can be used to create compelling 3D visualizations that make it easier to understand and communicate the real impact of flooding events.

Benefits

The flood impact analysis solution template leverages flood depth data to analyze the impact of flood events on critical assets such as buildings, bridges, low water crossings and roads. You can: 

  • Define flood impact areas at each flood stage
  • Determine what assets will be impacted and by how much
  • Communicate the results of the analysis to community stakeholders
  • create compelling 3D visualizations that make it easier to understand and communicate the real impact of flooding events. 

Example: Operations Dashboard for ArcGIS 

Get started with the Flood Impact Analysis solution

  1. Deploy the Flood Impact Analysis Pro project.
  2. Open the FloodImpactAnalysis.aprx in ArcGIS Pro

System requirements

The following software is required:

  • ArcGIS Pro 2.4 or higher (Advanced)
  • ArcGIS 3D Analyst extension
  • ArcGIS Spatial Analyst extension

Feedback

It would be helpful for us to know:

  • how these workflows and apps will benefit your organization
  • how the workflows and apps can be improved
  • any bugs or other issues.

For comments, questions, bug reports, new requirements: email gvanmaren@esri.com

more
14 31 15.6K
Gert_van_Maren
Esri Contributor

Make sure to check out the January 2019 release of the Local Government 3D basemap solution. This is a major release with a number of important updates:

  • 40% reduction in steps required for elevation, 3D buildings, floors and 3D trees publishing.
  • Faster processing speed when creating elevation layers.
    • Faster processing speed when extracting and fusing buildings.
  • Improved extraction quality and processing speed by adding the ability to:
    • do automatic flat and sloped roof form segmentation.
    • split building footprints by other features such as parcels.

segmentation comparison

Before and after pre-processing the building footprints using splitting and auto-segmentation.

  • Ability to add color to building roofs and facades.

color buildings

  • Tasks now work in any active scene.
  • LOD1 Building creation now supports selection.
  • Improved automatic unit conversion for default values in all tools.
  • External Task files are included in the project.
  • Support for ArcGIS Pro 2.3.

You can download the latest release of Local Government 3D basemaps solution here and please email feedback (bugs, enhancements) to gvanmaren@esri.com.

more
6 3 2,702
87 Subscribers