Bivariate Mapping
- Subscribe to RSS Feed
- Mark as New
- Mark as Read
- Bookmark
- Subscribe
- Printer Friendly Page
- Report Inappropriate Content
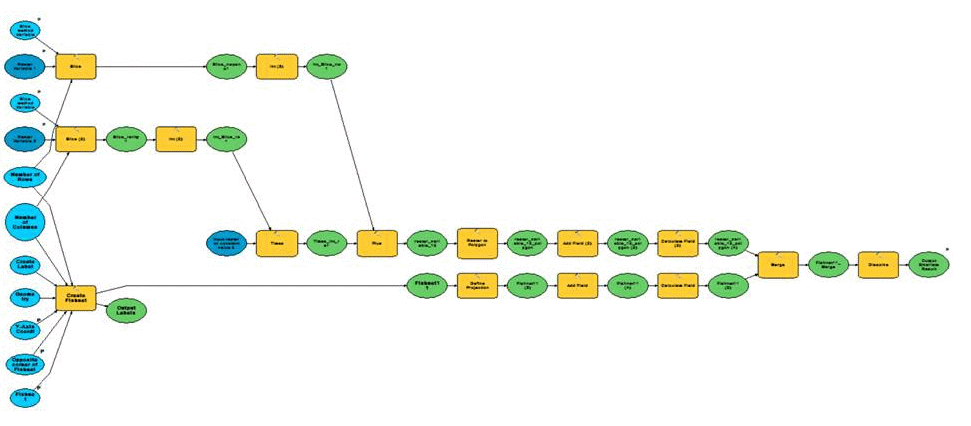
Bivariate legends are something that ESRI doesn't do very well. So since we wanted to generate bivariate legends we had to get a little creative. Using some creative ModelBu ilder tools you can create a bivariate legend within your map fairly simply using this model:
Basically using the Fishnet tool you can create your two dimensional grid in a user defined location on the map. Then reclass the two input raster layers using the Slice tool and the number of columns used in the fishnet tool. Next multiply one of the variables by 10 and add the two raster layers together. Convert them to polygons and merge the fishnet and the converted polygons and dissolve.
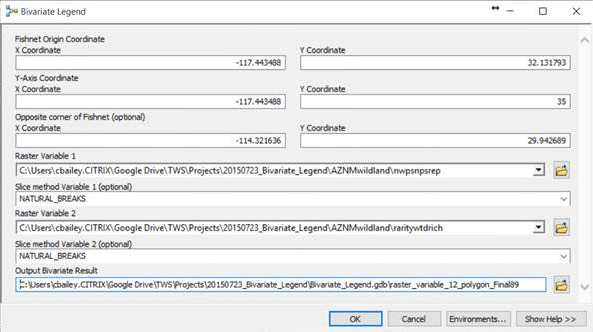
The bivarate tool interface is fairly easy to set up and can be run by anyone with the tool:

The Fishnet is a little tricky but if you use the Identify tool you can click the location for the upper left as the Fishnet Origin Coordinate, then the Y-Axis Coordinate is the same X location as the Fishnet Origin Coordinate and the Y Coordinate is a value higher than the Y Coordinate of the Fishnet Origin Coordinate value. To set the Opposite Corner of the Fishnet you can use the Identify tool to find the coordinates for the lower right location of your bivariate fishnet grid. Next select the first and second variable raster layers. I would suggest using the Natural Breaks or the Equal Area options for the Slice tools depending on your data distribution and how you want it to look like combined. Then set your output feature class and you are all set!
I have two examples both of which are published to ArcGIS server with an annotation layer that allows for text to be displayed along with the bivariate legend.
The first is within the Web App Builder
ArcGIS Web Application and notice that if you select any of the squares or the areas on the map it will highlight all similar values. This helps immensely with complex legends with so many colors.

The second is in Scene

Attached you will find the mxd, model and 4 class layer symbology if you would like to try it out.
You must be a registered user to add a comment. If you've already registered, sign in. Otherwise, register and sign in.