- Home
- :
- All Communities
- :
- Networks
- :
- Esri Startup Program
- :
- Esri Startup Program Blog
- :
- Add Intelligence to Your Apps & Maps with Rich Dat...
Add Intelligence to Your Apps & Maps with Rich Data from Esri’s GeoEnrichment Service by Esri Startup Program
- Subscribe to RSS Feed
- Mark as New
- Mark as Read
- Bookmark
- Subscribe
- Printer Friendly Page
- Report Inappropriate Content
The Esri Startup Program recently hosted a webinar on Esri’s GeoEnrichment Service. To view the recording, visit, https://attendee.gotowebinar.com/recording/7184501815662021121. The following blog provides important resources and code to help you get started.
Introducing GeoEnrichment
You and your developers now have another powerful tool in your ArcGIS toolbox: GeoEnrichment. Using the Esri GeoEnrichment Service capabilities in the Javascript API, you can create a web or mobile app that’s full of interactive demographic, consumer spending, landscape, and lifestyle data.
You can choose what types of demographic and other data your users need – examples include average household income, breakdowns of age and gender, or how much of the land is forested. Then you can dynamically obtain that information based on location, whether it’s around a point the user clicks, a dataset of existing locations, or just a set of named geographies (e.g. all zip codes in Oregon).
When you geoenrich point locations, you can even indicate how much of the surrounding area you want to summarize, like a 0.5-mile radius or a 10-minute driving distance.
Here’s a simple web tool our developers made that lets you explore GeoEnrichment data by address. To play with it yourself, go here. And of course, as a developer, you can design your web app to look and behave however you like, and you can use the GeoEnrichment data to do more complex data analysis.
For more information, check out these code sample:
- Explore data on a map:
- Pull data from the service:
- Explore hierarchies, answering questions like, ‘what well-known boundaries fall within this area?’:
- Perform simple REST / cURL requests:
- Read about all the different capabilities when programmatically using the service:
What Types of Data Can You Add?
There are thousands of variables you can add to your map and apps with GeoEnrichment. This data supports all kinds of industries and use cases, from commercial market analytics to economic development, planning, and disaster preparedness and response. Check out the interactive Data Browser to search and browse all the available variables.
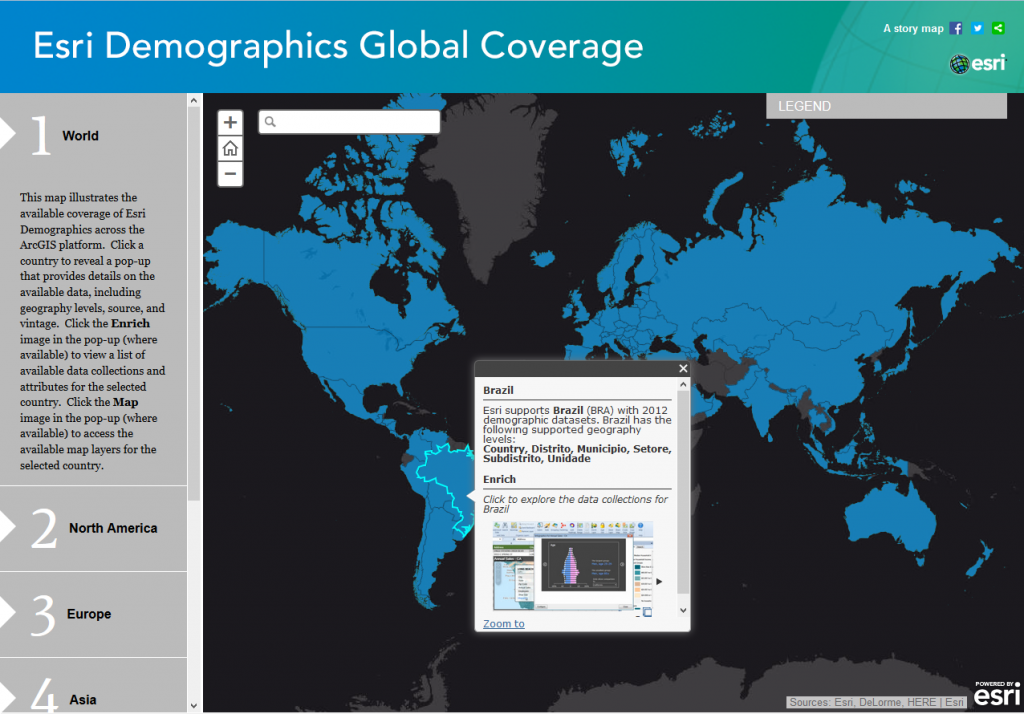
One of the main collections is the Esri Demographics data. Esri Demographics is a collection of global map layers available as part of your subscription that can be used for mapping and analysis purposes. Esri Demographics is accessible in four ways: dynamic web maps, data enrichment, reports, and infographics. View the Esri Demographics Global Coverage map to see the levels of data available for different countries.
In addition, Esri provides Tapestry Segmentation Data. Tapestry segmentation provides an accurate, detailed description of America's neighborhoods—U.S. residential areas are divided into 67 distinctive segments based on their socioeconomic and demographic composition. Try the Zip Code Lookup Viewer for demographics information about your neighborhood or customer base. Stay tuned, as the GeoEnrichment data is continuously updated throughout the year.
What are Some Outcomes of Using Esri GeoEnrichment Service?
The possibilities for GeoEnrichment are endless – here’s a few ideas:
- Choose where to open a new store based on the demographics of your ideal customer
- Learn more about the readers consuming content from your blog or website
- Decide where to advertise – on a billboard, bus stop bench, or with mobile advertising
- Find new potential customers who are like your best customers
- Pick the best venue for your event
- Learn about an area you’re not familiar with
- Figure out the difference between customers who buy product A vs. product B
- Decide which home to purchase
- Get ideas for new products based on what you can learn from the addresses or zip codes of your customers
- Determine what parts of their local environment may need protection
- Figure out why one store is outperforming another
- Decide where to put after school programs for children, or a senior center
- Identify vulnerable populations for emergency planning
- Decide where to place public transportation to maximize the population who uses and needs it
How do I Access the GeoEnrichment Service?
Sign in with your ArcGIS Online or Developer Account or sign up for a free Developers Account. After that, there are two ways to access the service. The first is to create an application in ArcGIS for Developers and generate a token with your application credentials. Once you have a token, you pass that as a token parameter with every request. This method will bill your application for the credits consumed by GeoEnrichment.
If you'd like to charge the users of the application for GeoEnrichment, you can have users sign in with OAuth 2.0. This will charge the user for any credits incurred by GeoEnrichment.
As a service, GeoEnrichment consumes credits depending on how much data you use. If you consume 1,000 data variables you will be charged 10 credits.
Here’s an example: Let’s say you added 500 points to your map and you want demographic information around each – say, two variables, like average household income and family size. When you run this GeoEnrichment analysis this will consume 1,000 data variables (500 points x 2 variables) and 10 ArcGIS Online usage credits. You and your app’s users can click on those 500 points as much as they like to view the data, and you won’t use any additional variables or credits. If you enable GeoEnrichment interactively, it would consume 0.02 credits (1 point x 2 variables) when the user picks a new location.
The new web maps and some reports for these datasets can also be accessed through apps such as Business Analyst Online, Community Analyst, Esri Maps, and Explorer. Learn more about these apps from Esri on the ArcGIS Marketplace.
Check out our developer plans for ArcGIS Online, which start at 50 credits/month for free while you develop your app, and then 200 credits for $20/month. There’s a lot more you can do with your developer plan beyond GeoEnrichment, too.
Have a question about Esri’s GeoEnrichment Service? Email startups@esri.com. Don't forget to watch the webinar: https://attendee.gotowebinar.com/recording/7184501815662021121.
Presented by Esri Startup Program: Kurt Daradics, Doug Carroll, Suzanne Foss, Kathryn Decker(Katie).
- Tags:
- api
- api javascript
- apps
- arcgis for developers
- arcgis java script api
- arcgis online
- blog
- credits
- data
- data enrichment
- demographic data
- developers
- esri startup program
- esristartups
- geoenrich
- geoenrichment
- geoenrichment service
- http
- infographics
- marketplace
- oauth
- standard geography query
- startups
- tapestry
- tapestry segmentation
- web maps
- webinar
- zip codes
You must be a registered user to add a comment. If you've already registered, sign in. Otherwise, register and sign in.