- Home
- :
- All Communities
- :
- Products
- :
- Spatial Data Science
- :
- Spatial Data Science Blog
- :
- Creating and Displaying Webmaps in Jupyter
Creating and Displaying Webmaps in Jupyter
- Subscribe to RSS Feed
- Mark as New
- Mark as Read
- Bookmark
- Subscribe
- Printer Friendly Page
- Report Inappropriate Content
Have you ever wanted to interact with a webmap using Python? Would you want to see those updates or modifications as soon as they happen? Using ArcREST in your Jupyter Notebook, you can create and modify webmaps and services and visualize those changes within seconds of them occurring without having to leave your Jupyter Notebook. In this post, I'll demonstrate how to display a webmap in your Jupyter Notebook and then how to use ArcREST to create a webmap and visualize it in Jupyter as soon as it's created.
Displaying a Webmap
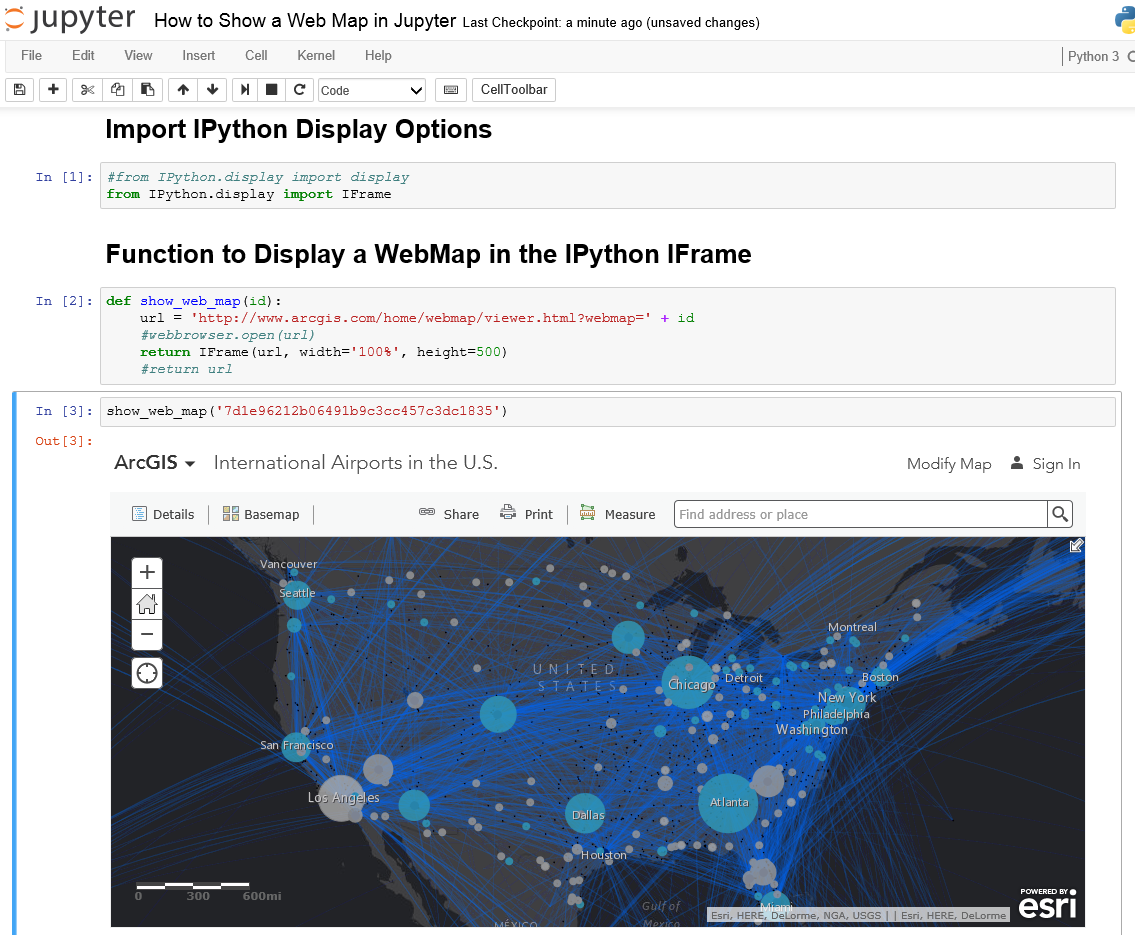
Displaying a webmap is pretty straightforward. First, I imported IFrame:
from IPython.display import IFrame
Next, I wrote a function to show the webmap in the IFrame given a webmap ID.
def show_web_map(id):
    url = 'http://www.arcgis.com/home/webmap/viewer.html?webmap=' + id
    return IFrame(url, width='100%', height=500)
Then, I called show_web_map and passed it a webmap ID.
show_web_map('7d1e96212b06491b9c3cc457c3dc1835')Here's the result:
Using Jupyter with ArcREST to Create and Display a Webmap
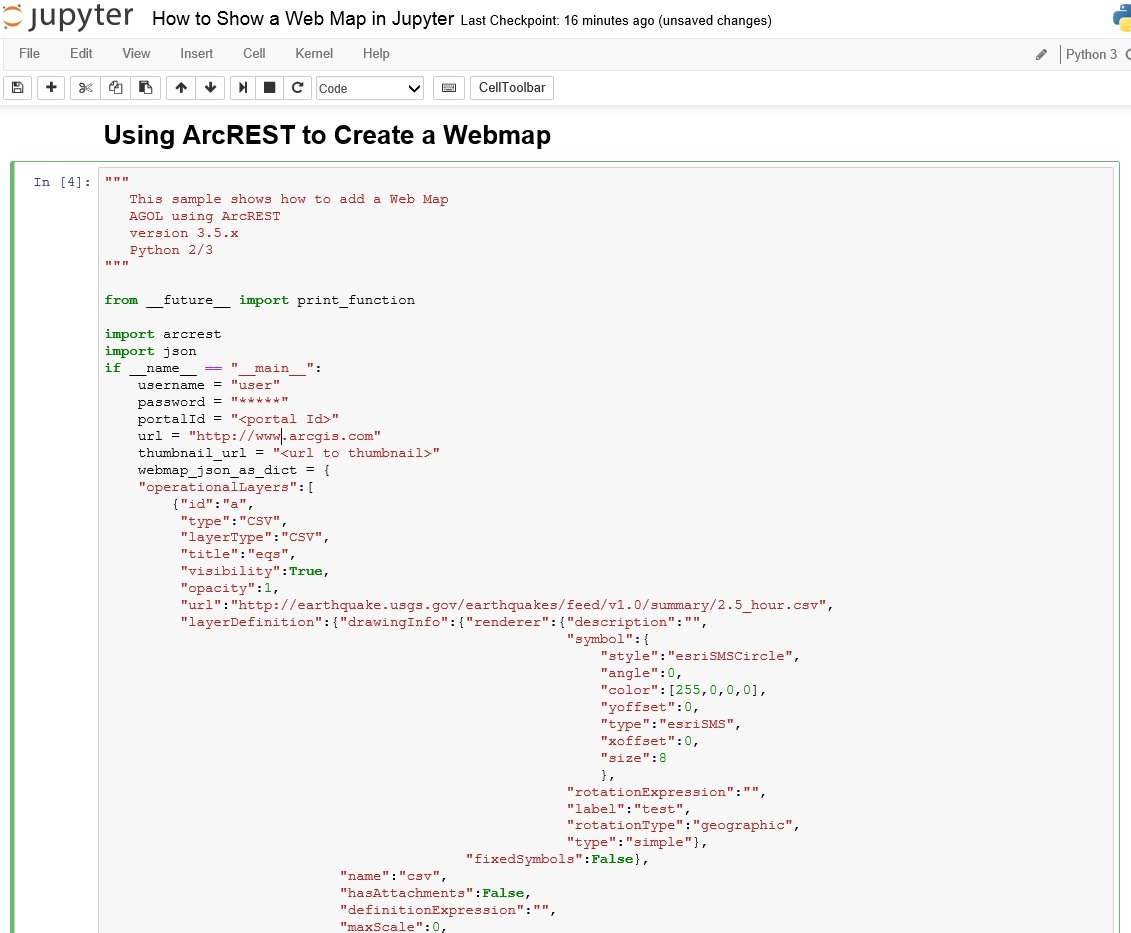
The above example is cool, but you might be asking, "How is this useful?" Displaying the web map in your Jupyter Notebook can become really powerful if you use ArcREST and are creating or editing a service or a webmap. To demonstrate this, I downloaded and installed ArcREST. I wanted to show that I can dynamically create a webmap and visualize it in my Jupyter Notebook in a matter of seconds, so I copied the additem_webmap_sample.py script into my Notebook. This sample script grabs the all_hour.csv file and 2.5_hour.csv file from the USGS earthquake feed and adds those earthquake features to a webmap. Here's the script in my Jupyter Notebook:
I concealed my username and password above, so you'd have to insert your info there. I modified and added these last few lines:
item = user.addItem(itemParameters=itemParams,overwrite=True,
                    text=json.dumps(webmap_json_as_dict))
#Share the item with everyone
item.shareItem(everyone=True)
print(item.id)
I made sure to share the resulting webmap with everyone so that it shows in the Jupyter Notebook without having to login. After running the additem_webmap_sample.py script, I showed the webmap by calling the item ID.
show_web_map(item.id)Here's the resulting webmap in my Jupyter Notebook:
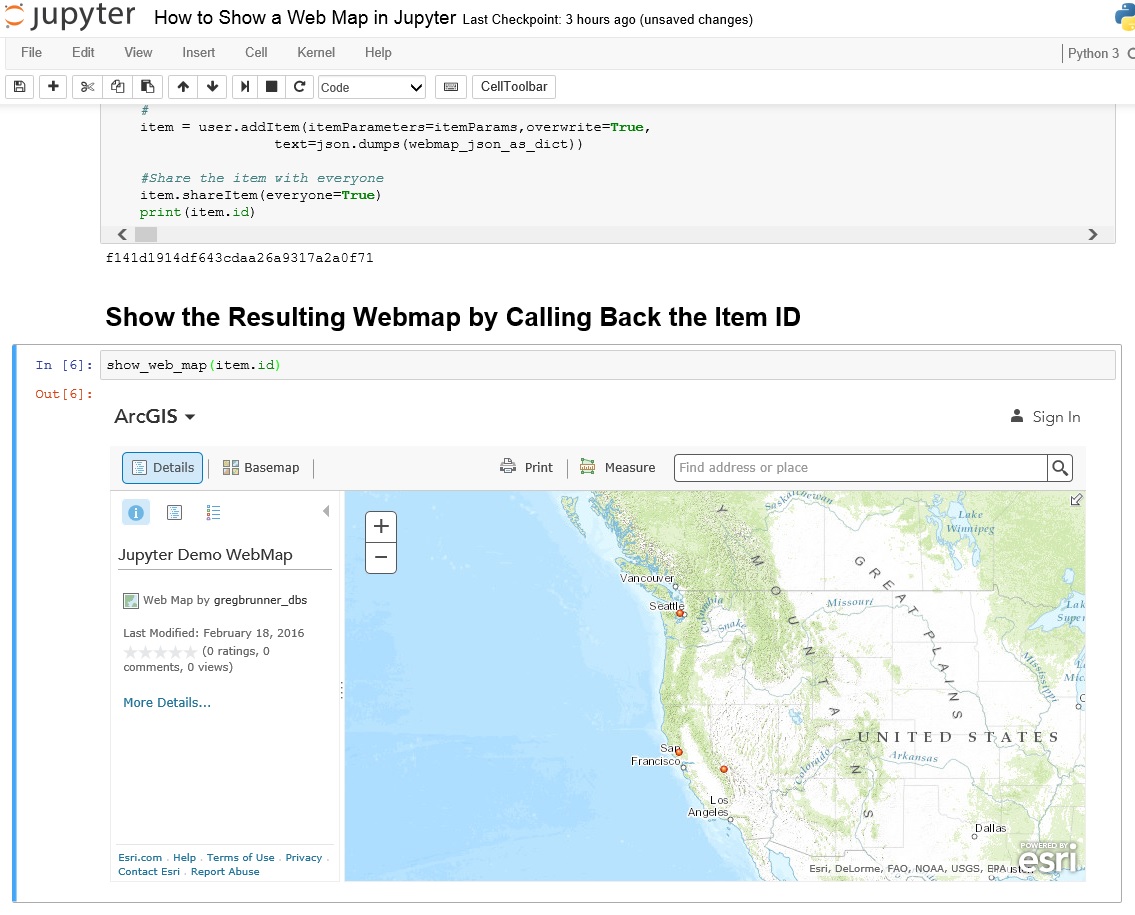
I was able to verify that those were the only three earthquakes in the last hour by downloading the all_hour.csv file.
A Quick Way to Create, Update, and Visualize Webmaps and Services
While the example above is pretty simple, I think it lays a good framework for how Jupyter can be used to work with webmaps and services. If you have the need to periodically update a webmap and use ArcREST to do it, Jupyter makes it easy to run the script and check the result in a single location. If you want to batch create some webmaps and see the results, Jupyter makes reviewing the webmaps easy. Or if you're looking for a playground for creating and updating webmaps, Jupyter is good for that too. Hopefully the examples above demonstrate that and give you some ideas for how to work with webmaps and services using Python and Jupyter.
For more spatial data science tips and tricks, check out the Data Science group or reach out to Gregory Brunner.
You must be a registered user to add a comment. If you've already registered, sign in. Otherwise, register and sign in.