- Home
- :
- All Communities
- :
- Products
- :
- ArcGIS Survey123
- :
- ArcGIS Survey123 Blog
- :
- Understanding Your Results with the Analyze Tab
Understanding Your Results with the Analyze Tab
- Subscribe to RSS Feed
- Mark as New
- Mark as Read
- Bookmark
- Subscribe
- Printer Friendly Page
- Report Inappropriate Content
You've collected your data using Survey123 for ArcGIS, what's next? There are several ways the Survey123 website can help you analyze and visualize the results of your survey. The Analyze tab enables some great reporting capabilities that help you review, understand, and interpret your survey results. It provides some simple, but very powerful reporting tools such as making charts, word clouds, etc. These tools can help you better interpret your survey results.
Viewing Results - The Analyze tab
At the Analyze tab of a survey, you can view the aggregate results of your survey- each question, aside from image questions, will display a chart. Depending on the data type, the charts available will be different:
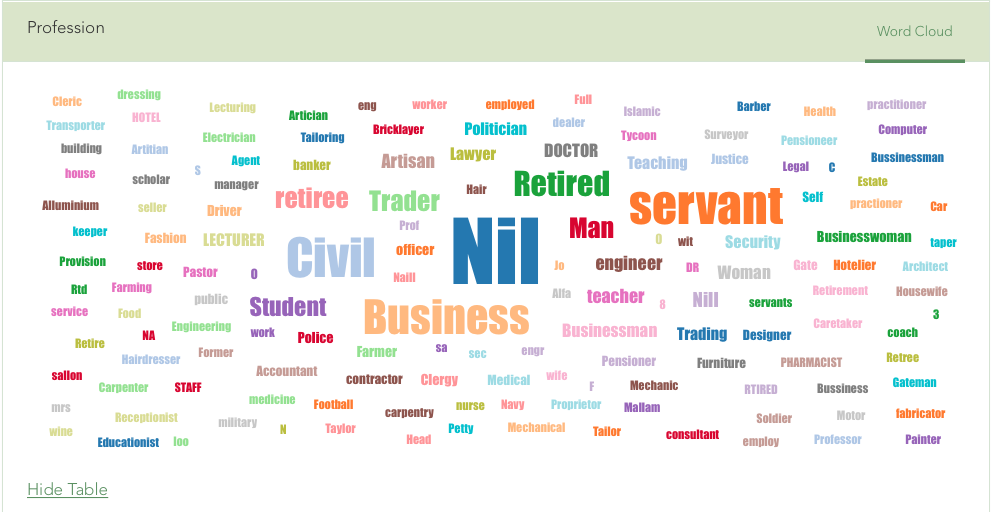
- Text (free text): The most common words by count will be displayed as a word cloud (requires at least 20 entries)
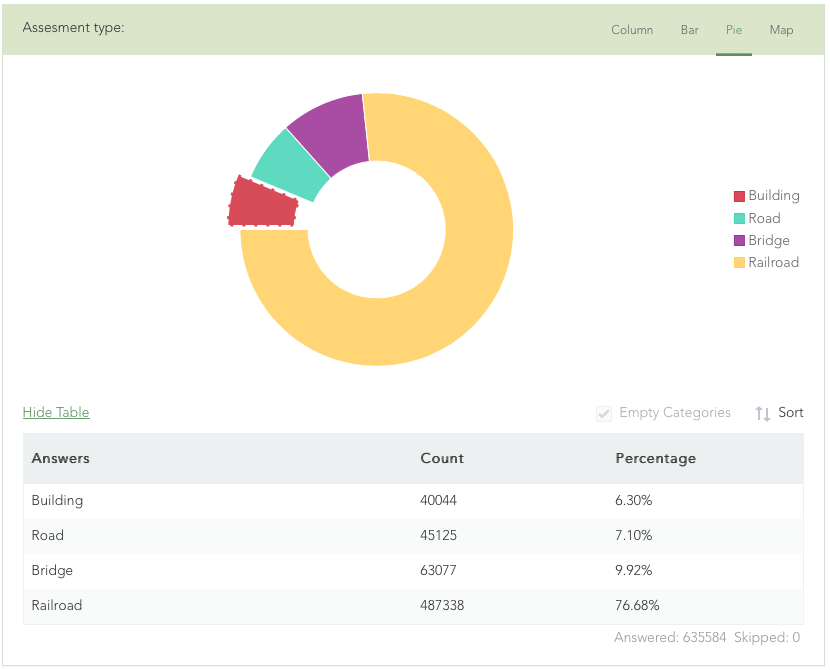
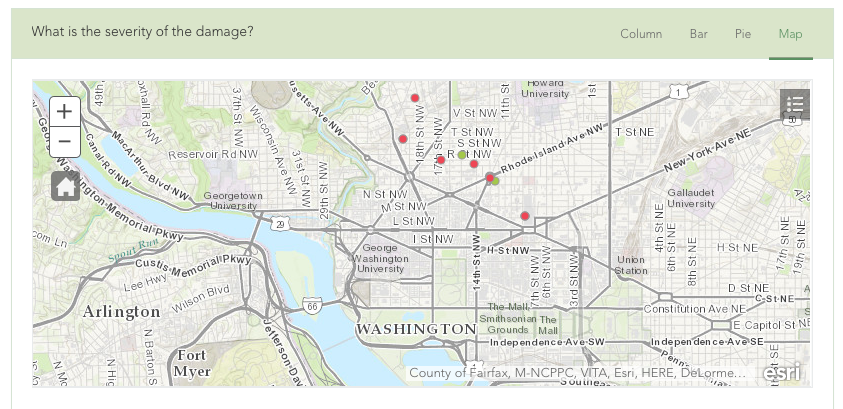
- Single Choice Questions: Column, Bar, and Pie charts, as well as a map color-coded by answer


- Multiple Choice Questions: Column, Bar
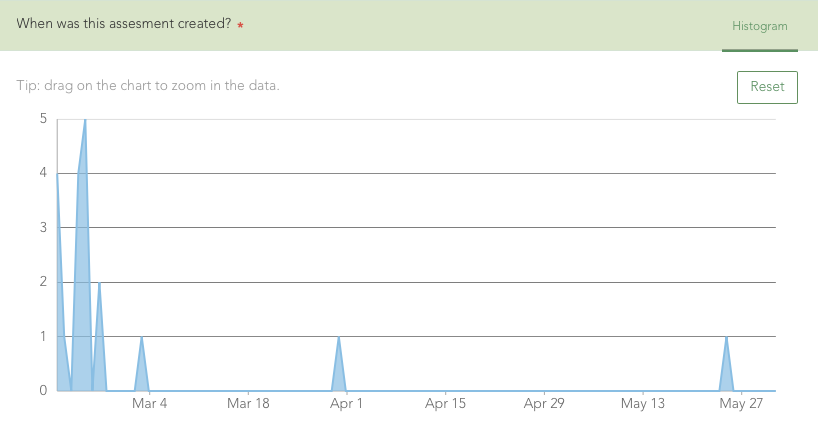
- Date questions: Histogram
Printing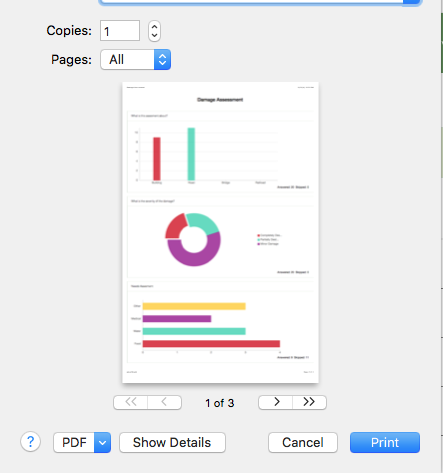
From the Analyze tab, you can print your entire survey summary results as a PDF file. You can alternatively hide questions from your report using the 'Visibility' setting. When ready to print, use the 'Print Current View'; if your browser supports PDF generation, you can then save the result to a PDF file.
With the latest update to the Survey123 website we also have enabled the printing of individual responses. In the 'Data' tab is now the option to view the details of a response. From there you can print that detail or save as a PDF file.
What will we improve?
Looking forward, an area we are working on is providing additional capabilities to filter survey data totals to be able to see statistics based on the values of questions or submission time. We also want to support bulk printing of records.
We also want to enable you to share the survey results with groups of people. At the moment, only the owner of the survey can look at the analyze tab.
Try out the Analyze tab, Detail view, and printing and let us know what you think!
You must be a registered user to add a comment. If you've already registered, sign in. Otherwise, register and sign in.