- Home
- :
- All Communities
- :
- User Groups
- :
- New to GIS
- :
- Questions
- :
- How to display category and quantity data combined...
- Subscribe to RSS Feed
- Mark Topic as New
- Mark Topic as Read
- Float this Topic for Current User
- Bookmark
- Subscribe
- Mute
- Printer Friendly Page
How to display category and quantity data combined?
- Mark as New
- Bookmark
- Subscribe
- Mute
- Subscribe to RSS Feed
- Permalink
- Report Inappropriate Content
This is a very basic question - so I apologise in advance...
I have water chemistry data (nitrate etc.) that I wish to display as expanding circles depending on quantity over a map of farmland streams.
All I wish to also do is to also add category data to colour these circles in four different colours depending on the landowner. The final output will be different colour circles (dependent on landowner) in different sizes (dependent on nitrate concentrations).
This - I am sure - is extremely simple, but the videos I have watched so far do not combine the two.
Many thanks in advance!
- Mark as New
- Bookmark
- Subscribe
- Mute
- Subscribe to RSS Feed
- Permalink
- Report Inappropriate Content
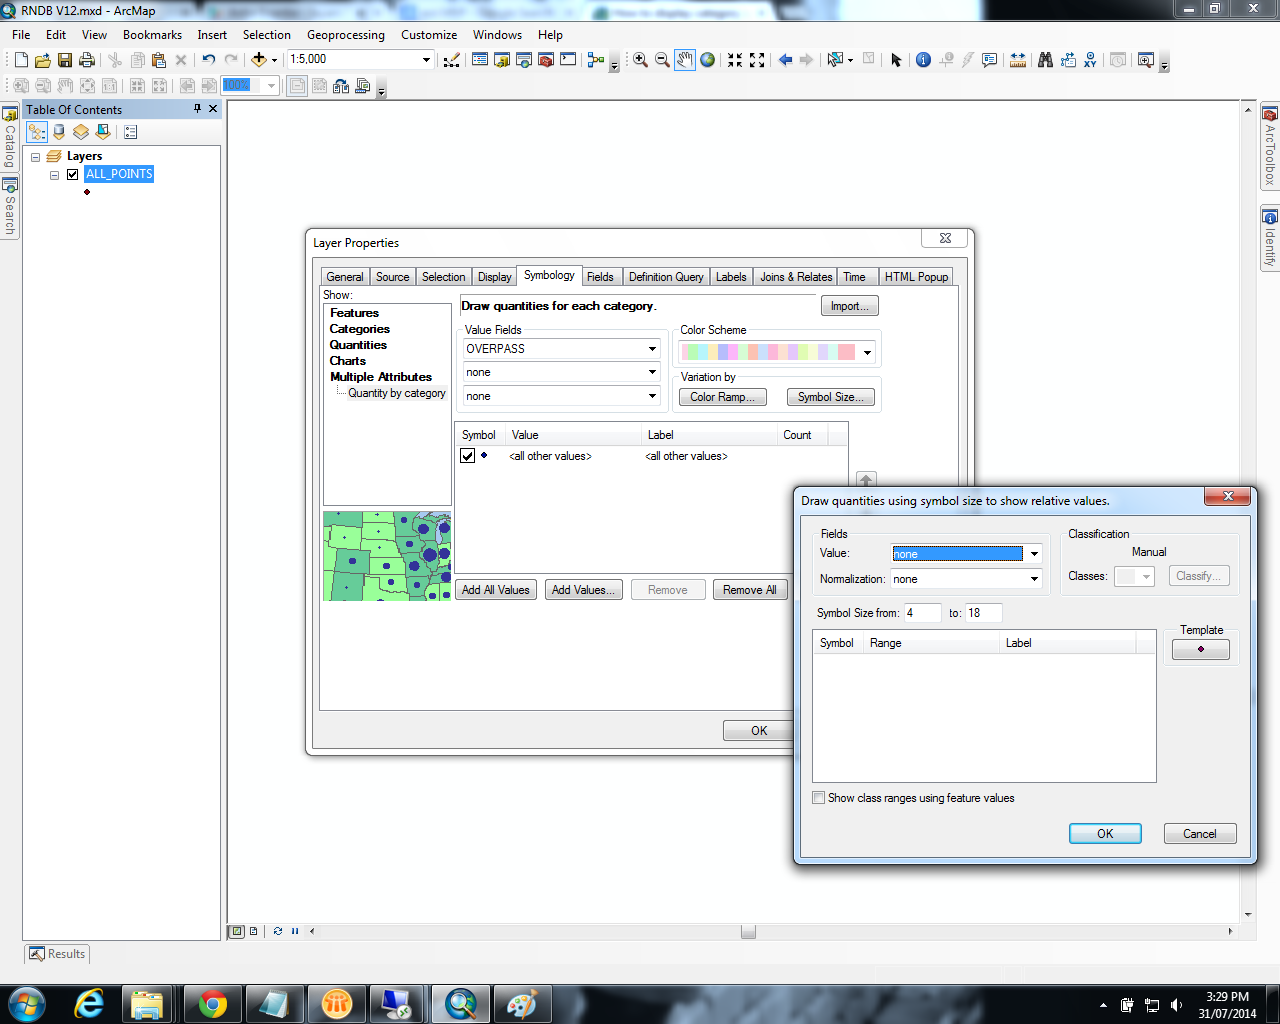
Double click on the layer's name and select the Symbology tab...see the image, it may be what you are looking for
- Mark as New
- Bookmark
- Subscribe
- Mute
- Subscribe to RSS Feed
- Permalink
- Report Inappropriate Content
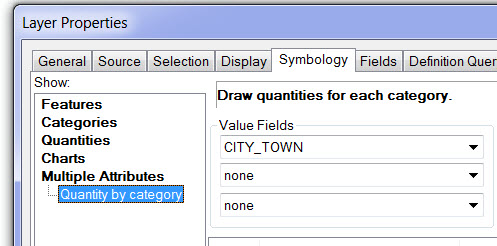
Expanding on what dan has already suggested.
You should land owner attribute as Value fields (where i have used overpass) and set chemistry data as value field using Symbol Size, you should get what you are looking for.