- Home
- :
- All Communities
- :
- Industries
- :
- Water Resources
- :
- Water Resources Questions
- :
- Spatial Analyst Watershed tool
- Subscribe to RSS Feed
- Mark Topic as New
- Mark Topic as Read
- Float this Topic for Current User
- Bookmark
- Subscribe
- Mute
- Printer Friendly Page
Spatial Analyst Watershed tool
- Mark as New
- Bookmark
- Subscribe
- Mute
- Subscribe to RSS Feed
- Permalink
- Report Inappropriate Content
I am attempting to identify a few subwatersheds within a study area; however, the Spatial Analyst Watershed tool has not produced expected results. Apologies if this repeats previous questions, but I did not see any existing discussions that addressed my current situation in enough detail.
I have already used the Fill sinks and Snap Pour Points options to adjust the input datasets, yet the output results of the Watershed tool only creates a very small raster in the immediate vicinity of each pour point. I have used a 30m DEM as well as a resampled 10m version. All of the datasets use the same geographic coordinate system, so I'm not sure what else to consider. There must be some step in the process that I am missing that is not identified or explained in the tool help information.
I have attached a copy of the current Watershed tool result. Any assistance would be appreciated.
Thank you.
UPDATE 04/02/2015 17:15 ET
I started the process again from the beginning using the following steps:
1. New elevation raster with 3m resolution.
2. Fill sinks.
3. Resampled elevation raster to 10m resolution (per a suggestion that 3m might be too fine).
4. Created flow direction raster (with Force edge cells to flow out selected). tested with Force selected and not selected
5. Created flow accumulation raster.
6. Set Snap Pour Points using flow accumulation raster.
7. Ran Watershed tool using the Snap Pour Points.
To clarify, all input datasets use the same projected coordinate system (NAD 1983 HARN State Plane Delaware).
The results still seem to be unreliable. An updated version of the output is attached. The flow accumulation raster appears in the background. The black outline (previously created by a colleague) describes the larger watershed area of interest. My goal is to delineate subwatersheds behind sampling sites that are described by the pour points. Is there something else that I'm missing? Does the specific projection matter? Or is the elevation and flow direction data problematic because it is relatively flat?
- Mark as New
- Bookmark
- Subscribe
- Mute
- Subscribe to RSS Feed
- Permalink
- Report Inappropriate Content
I run into this sometimes and when I do I find it is best to fall back on an overview of the whole process to make sure a step was not skipped. More times than not I realize then that I have skipped a necessary step or did a process out of sequence. So to start, check out the diagram here and see if you did all the steps, and in the correct sequence:
Deriving Runoff Characteristics
Chris Donohue, GISP
- Mark as New
- Bookmark
- Subscribe
- Mute
- Subscribe to RSS Feed
- Permalink
- Report Inappropriate Content
You said "geographic coordinate system" You are using projected data I assume and that this is just a slip on your part? If not, then the elevations and X,Y coordinates will be in different units and the results will be confusing at best. This may affect how the fill process goes etc. Make sure that you are indeed using projected data in all steps and that the sequence of steps is indeed correct.
- Mark as New
- Bookmark
- Subscribe
- Mute
- Subscribe to RSS Feed
- Permalink
- Report Inappropriate Content
I have that problem when my pour points are a little off the local minimums. But you said you used the Snap Pour Point Tool. In an edit session, try displaying your flow accumulation raster behind your pour points. Play with the symbology classification of your accumulation raster so you can see the stream lines distinct from the real low accumulation values. Move the pour points so they will sit right on top of a pixel in the accumulation with the highest value near where you thought the pour point should be.
Sometimes, however, with real flat terrain, the flow modeling just doesn't work as expected. Especially with coarser DEM data like 30 m cells. You don't get more accurate data by resampling to 10m, you get each 30 m cell chopped into 9 cells with the same value (basically).
- Mark as New
- Bookmark
- Subscribe
- Mute
- Subscribe to RSS Feed
- Permalink
- Report Inappropriate Content
Matthew, it looks to me like you snapped your pour points to a vector stream layer, which may not be the same as the calculated streams from a flow accumulation. As Paul is saying, you need the pour points to be on the cells of highest flow accumulation. You can use the flow accumulation to produce a modeled vector stream layer, and then snap your pour points to that.
- Mark as New
- Bookmark
- Subscribe
- Mute
- Subscribe to RSS Feed
- Permalink
- Report Inappropriate Content
Hi Matthew:
I believe the problem you are having can be resolved by setting the analysis extent for the WATERSHED tool. To do this:
- Click on the "Environments..." button at the bottom of the WATERSHED GUI
- Expand the "Processing Extent" category
- From the "Extent" dropdown select your flow direction grid from the list populated from your table of contents
- Finally, select "OK" to return to the WATERSHED GUI.
After setting the analysis extent you can populate the WATERSHED GUI as required and then run the tool.
For whatever reason, the default analysis extent for the WATERSHED tool does not seem to be set the same way as it is for other tools, thereby requiring us to remember to set this each time we use the WATERSHED tool. To overcome this, I have put together a Python script tool that sets the extent to the flow direction grid, and I have built in a few other enhancements as well.
Hope this helps!
- Mark as New
- Bookmark
- Subscribe
- Mute
- Subscribe to RSS Feed
- Permalink
- Report Inappropriate Content
Thank you for all of the advice. Although each comment was certainly constructive, no single suggestion offered a successful solution. At this point, I achieved what I believe to be a usable result after clipping the 3m DEM to the preexisting watershed extent and creating the flow direction and accumulation rasters from that clipped DEM. I created the flow direction raster without using the 'force edge cells to flow out' option. After using an edit session to place the proposed pour points in the approximate locations where I think they belong, I then used the Snap Pour Point tool to find the points of highest accumulation within 12m of the points that I placed and used those results in the Watershed tool. That watershed result is shown here.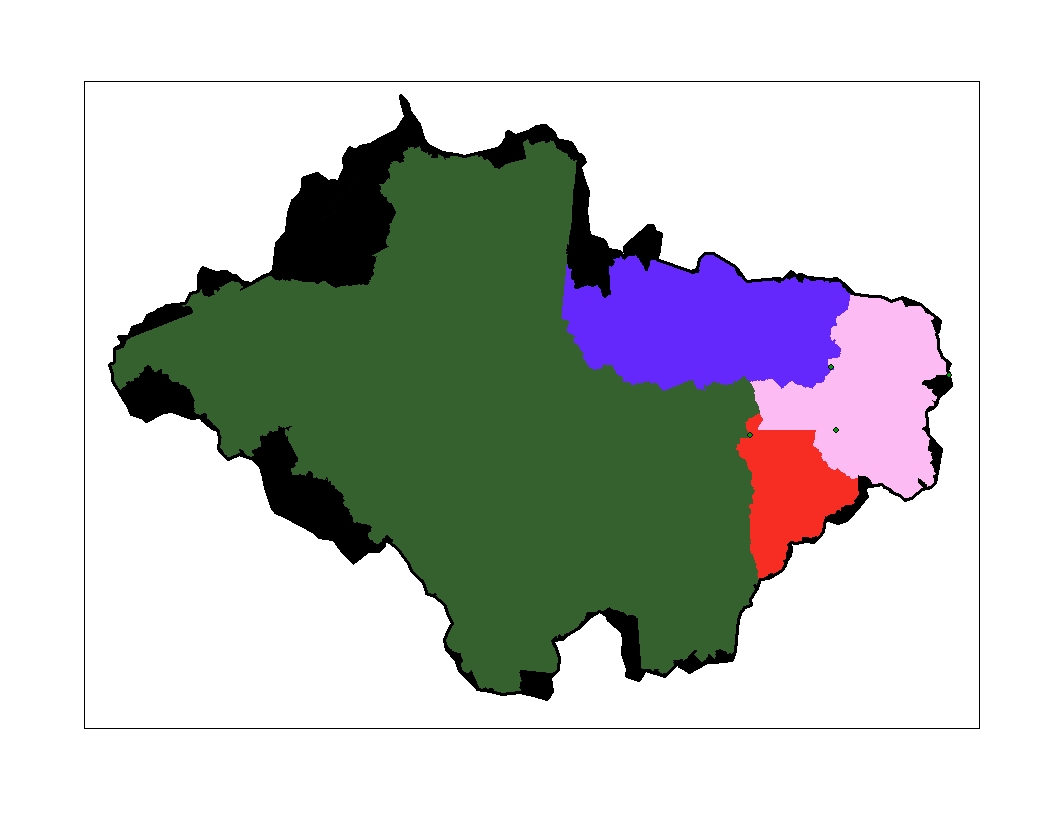
I think this result is acceptable. If there are any ideas to improve this result, I will certainly appreciate further suggestions. Otherwise, I will convert this to a shapefile and adjust the boundaries as necessary. Thank you.
- Mark as New
- Bookmark
- Subscribe
- Mute
- Subscribe to RSS Feed
- Permalink
- Report Inappropriate Content
Glad you finally got it working. I suspect the two things that may have tripped you up are:
1) One should not resample or project elevation derivatives. In fact, it's a good plan to use the raster environment settings to help you out once your elevation data are finalized, that is, before the Fill tool is run. Right before the fill, set the extent, snap and cell size environment to match the elevation raster.
2) Interactively edit the gage point locations using the synthetic flow network, and after that, use the Snap Pour tool to make doubly sure they are placed on the locations.
- Mark as New
- Bookmark
- Subscribe
- Mute
- Subscribe to RSS Feed
- Permalink
- Report Inappropriate Content
I'd just like to add that I feel it is fine to resample elevation measurements, as long as someone stays away form the nearest neighbor algorithm. With elevation data you always want to choose an algorithm that is appropriate for continuous data (such as bilinear or cubic spline) and never the nearest neighbor.
This problem also surface when projecting the data from a GCS - never ever choose nearest neighbor. I can result in added or missing grid cells that will greatly mess with any hydrology analysis.
See my question and self answer here for more info: