- Home
- :
- All Communities
- :
- Products
- :
- Spatial Data Science
- :
- Spatial Data Science Questions
- :
- Re: Tools and Techniques for Articulating Constrai...
- Subscribe to RSS Feed
- Mark Topic as New
- Mark Topic as Read
- Float this Topic for Current User
- Bookmark
- Subscribe
- Mute
- Printer Friendly Page
Tools and Techniques for Articulating Constraints
- Mark as New
- Bookmark
- Subscribe
- Mute
- Subscribe to RSS Feed
- Permalink
- Report Inappropriate Content
As a newcomer to the world of GIS and spatial analysis I have found myself with a challenge that I am hoping the Geonet community may be be able to support me with. Let me explain:
I have undertaken the challenge to define the environmental constraints for our development site. This is something that has been attempted in the past with (in my opinion) incomplete/misleading deliverables being produced. This called out to me as an opportunity to "get it right" and also develop my own knowledge of producing this kind of map. I am a new user of GIS (circa 6 months) as is the company I work for - previous maps had been made in CAD.
The first thing I realised was that the issue wasn't "What information do we need to show?" - that was relatively straight forward after gathering requirements from the relevant specialists. The challenge lies in "How do we present that data as meaningful information?"
Here is an example: previous maps presented ecology survey results as point data - hang on, don't these guys move?! Maybe we should be looking at identifying habitats suitable for that species around that point where you may encounter them. Another example are the watercourses; previous maps showed the network which to me says "This watercourse is a constraint, don't carry out work here" What we actually mean is within 5 meters we are not permitting work but from 5 to 10 meters it is possible with consideration, outside of this buffer you are free to work.
I hope that's enough of a background and provides some context to my question - i am coming onto it, I promise.
The first phase of the plan is now taking shape. We have identified the constraints, they have been buffered and the map will be supported with contextual information to ensure its content is interpreted in the right way. At the moment it looks like the 1970s vomited on a page! Helpful if you want to see specific information but it does not provide the overview that is also required.
I want to create a layer that identifies how constrained (a combination of number of constraints and the rating i.e. high, medium or low risk) a parcel of land is and produce an overall heatmap showing the same across the site. Can anybody provide me with some guidance?
Do I need to reclassify my information? Is there a technique, maybe weighted overlay that will help me achieve this?
Any support, as always, would be greatly appreciated.
Thanks
Solved! Go to Solution.
Accepted Solutions
- Mark as New
- Bookmark
- Subscribe
- Mute
- Subscribe to RSS Feed
- Permalink
- Report Inappropriate Content
If you have access to the Spatial Analyst extension, you could do the analysis in raster format. In that case you might be interested in Exercise 3 of the Spatial Analyst tutorial: ArcGIS Help (10.2, 10.2.1, and 10.2.2)
It is also possible to do the analysis in vector format. You should have a "suitability" for each input and by combining (union) the input polygon featureclasses (such as buffers of watercourse etc) you will be able to sum the values of the suitability and present that with the appropriate color scale to symbolize the scale of suitability.
- Mark as New
- Bookmark
- Subscribe
- Mute
- Subscribe to RSS Feed
- Permalink
- Report Inappropriate Content
That's really useful. I will attempt both and compare the results. Thank you.
- Mark as New
- Bookmark
- Subscribe
- Mute
- Subscribe to RSS Feed
- Permalink
- Report Inappropriate Content
In addition to Xander's suggestion have a look at the sections from here on down.
ArcGIS Help (10.2, 10.2.1, and 10.2.2)
Pay particular attention to the coordinate system and cell size that you choose for your analysis. Often these aspects are overlooked and the work needs to be done again. Your boundaries are not going to be definitive in most cases, so some modelling changes in threshold values would be recommended. This is obvious when trying to assess 'costs' whether monetary versus others.
overlay tools .... fuzzy and conventional
- Mark as New
- Bookmark
- Subscribe
- Mute
- Subscribe to RSS Feed
- Permalink
- Report Inappropriate Content
Thanks Dan. I have posted a reply to Xander's suggestion showing my method. I will be sure to review aspects such as the cell sizes. The size of the features we are talking about ranges from 10 meters in diameter to 1000s m2.
- Mark as New
- Bookmark
- Subscribe
- Mute
- Subscribe to RSS Feed
- Permalink
- Report Inappropriate Content
So... I finally got round to trying this out (I am currently moonlighting from my day job to support business users).
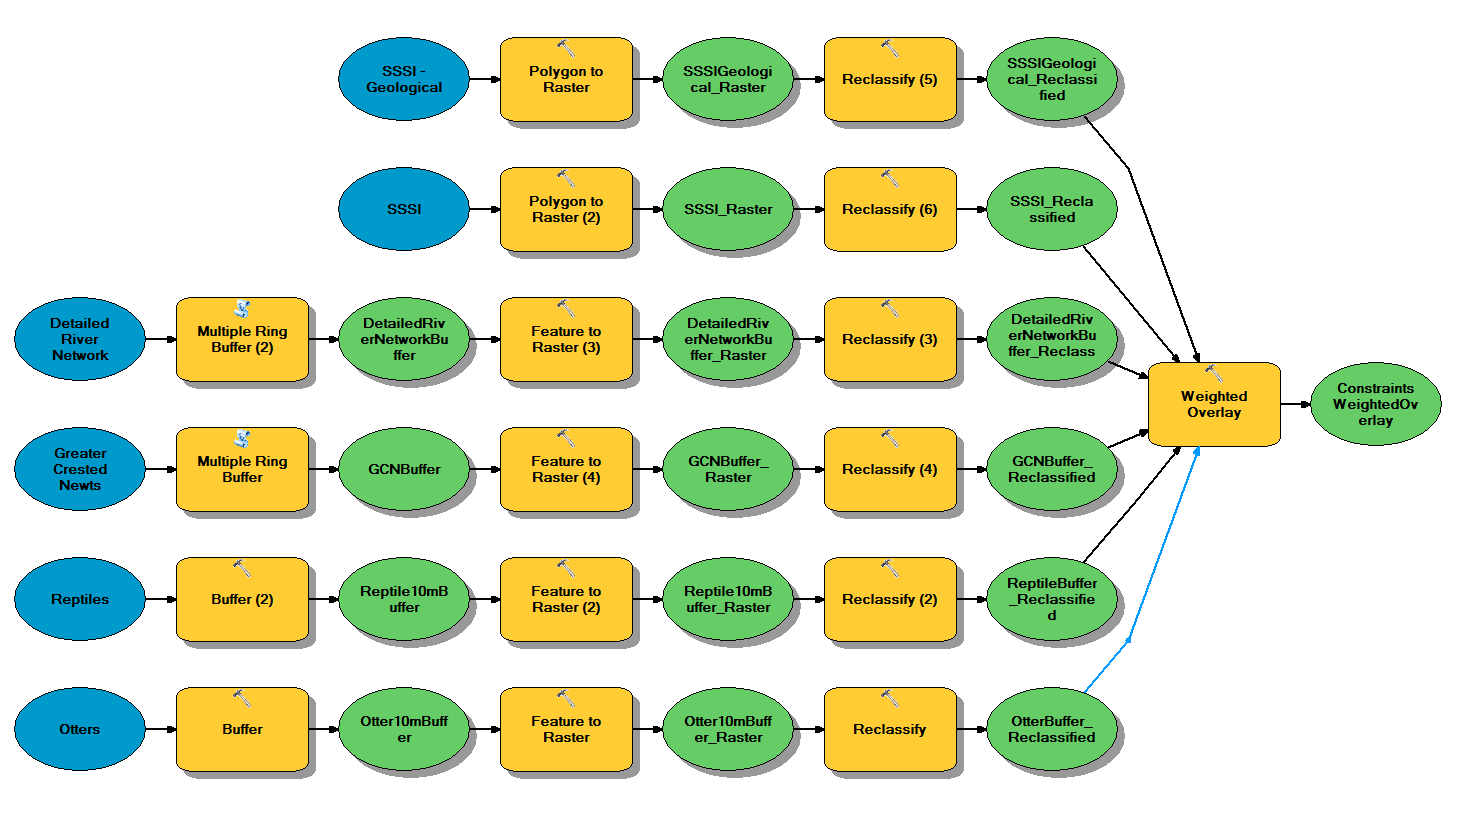
So my model has started to look like the one above. As you can see i will be combining a number of layers of data - this is probably half of them but I am going to try it out before I add them all.
All feautres have been converted to rasters, reclassified with a commmon value (the lower the number the higher the risk).
When using weighted overlay, all input rasters have an equal weighting.
How does this look?
- Mark as New
- Bookmark
- Subscribe
- Mute
- Subscribe to RSS Feed
- Permalink
- Report Inappropriate Content
Hi Chris Scott ,
I think it looks fine, but much depends on the size of the buffers, reclassification and weights assigned (equal in your case) which I cannot see from the image you posted. I guess it'll be alright.
As an alternative, also suggested by Dan Patterson , you could use the Fuzzy Product or Fuzze Sum to get the result (see ArcGIS Help (10.2, 10.2.1, and 10.2.2) ) This method is used when the boundaries between classes are less defined and is based on the fuzzy membership of each suitability layer.
- Mark as New
- Bookmark
- Subscribe
- Mute
- Subscribe to RSS Feed
- Permalink
- Report Inappropriate Content
I didnt have sucess with the model I ran above and will need to rethink this. The output is not what I expected (see below:)


I'm not giving up on this method - I want to know where I went wrong. Any advice or tips on where to look would be great.
Thanks
- Mark as New
- Bookmark
- Subscribe
- Mute
- Subscribe to RSS Feed
- Permalink
- Report Inappropriate Content
Some broad tidbits to pass on that may be of help based on my experience in Environmental Consulting for 20+ years:
1. When doing environmental constraints for development in the United States, there may be a regulatory requirement with defined criteria that must be met, including GIS specifics. If you are doing this evaluation to meet a requirement, be it local, State, or Federal, it will be incumbent to look up the expectations. For example, if you are doing a Wetland Delineation to meet U.S. Corps of Engineers requirements for a permit (Section 404 of the Clean Water Act), the Corps defines how one goes about doing that analysis and how the GIS result needs to be arranged.
Even if your analysis is not for the purpose of meeting a regulatory requirement, it can be helpful to see how others are addressing it. That's not to say the requirements will necessarily be the best or most refined way to do the analysis, but it will provide an idea of the standard way it is being tackled.
2. In terms of data, even if there is not a specific requirement, save copies of your intermediate layers so you can produce figures showing each stages' result besides the final result. I've done several projects where the client and/or regulators wanted to see the intermediate results after seeing the final results. They usually want paper maps, so even though you have a Model that you can give them besides the starting data, they usually aren't interested in using GIS to check the results.
This is particularly important if you are trying to negotiate with Regulators over a non-typical situation. For example, we worked out an Exemption from the Fish and Wildlife Service for a large residential development project after we conclusively showed that the development would be downhill of a collection of Vernal Pools, which are sensitive ecological areas. Normally, there is a substantial non-development buffer around Vernal Pools to protect them from potential pollution flowing into them, but in this case they were all well upslope from the development. However, this was not obvious from a quick viewing of a map.
Chris Donohue, GISP