- Home
- :
- All Communities
- :
- User Groups
- :
- New to GIS
- :
- Questions
- :
- relating table to feature class 1-M
- Subscribe to RSS Feed
- Mark Topic as New
- Mark Topic as Read
- Float this Topic for Current User
- Bookmark
- Subscribe
- Mute
- Printer Friendly Page
- Mark as New
- Bookmark
- Subscribe
- Mute
- Subscribe to RSS Feed
- Permalink
- Report Inappropriate Content
Hello,
I'm relatively new to ArcGIS. I taught myself to do some things a couple years ago and am now trying to relearn it. I have some tables of data that I need to relate to a point shapefile. Basically, the tables contain details of crimes committed in various locations. So one location (point) has many crimes. So far I have
1. converted the shapefile to a feature class
2. created a relationship class between the table and the feature class
Now I am trying to create a query table which brings together data from the feature class and the shapefile. But when I try to match the location fields in the table and feature class in the SQL builder, I get an error message, 'an expected field was not found or could not be retrieved properly'. I cannot work out what is wrong with the table (checked all the field names for spaces and length, and data appears in the relationship class I created ok when I look in the attribute table) or the SQL expression (I've got the double quote marks and no spaces). I want to create this query table so that I am eventually able to scatter the locations of the crimes, so that they do not appear stacked on top of each other.
It might be that I am doing this in a roundabout/ laborious way and there is an easier way to relate the original point shapefile to the table in a 1-M relationship that would enable me to then scatter the points. Any advice very very gratefully received!
Many thanks,
Rosalind.
Solved! Go to Solution.
Accepted Solutions
- Mark as New
- Bookmark
- Subscribe
- Mute
- Subscribe to RSS Feed
- Permalink
- Report Inappropriate Content
Hi, I had *exactly* the same problem and I found the answer by accident:
When you do the SQL statement, it auto-adds speech marks around the column headers. It seems madness, but if you delete those quote marks it will work! Obviously there's a bug somewhere 
All the best,
Hen
PS Just remembered, this blog post may help with getting the set up right: A Quick Tip on Performing a 1:M Join | Support Services Blog
- Mark as New
- Bookmark
- Subscribe
- Mute
- Subscribe to RSS Feed
- Permalink
- Report Inappropriate Content
ArcGIS Help 10.1 - Make Query Table (Data Management)
You may need to prefix the field names with the table name. Like MyFC.FieldName1 and MyTable.FieldName2
- Mark as New
- Bookmark
- Subscribe
- Mute
- Subscribe to RSS Feed
- Permalink
- Report Inappropriate Content
It's hard to say, without seeing a sample or screenshot of your data tables. Can you join them using a Spatial Join (ArcGIS Desktop)?
- Mark as New
- Bookmark
- Subscribe
- Mute
- Subscribe to RSS Feed
- Permalink
- Report Inappropriate Content
It might be that I am doing this in a roundabout/ laborious way and there is an easier way to relate the original point shapefile to the table in a 1-M relationship that would enable me to then scatter the points.
So you goal is to scatter the points if due to the 1:M relationship, multiple points are located on the same position?
- Mark as New
- Bookmark
- Subscribe
- Mute
- Subscribe to RSS Feed
- Permalink
- Report Inappropriate Content
Thanks for your tips!
Perhaps a little more information from me would be useful. I'm working with an historical source which gives locations of crimes by parish in a county in England. Unfortunately, the location data is not more refined than that. I have a polygon shapefile of all the parishes in that county. From that shapefile I created a point shapefile. I want to show where in the county (which parishes) the crimes happen in. And I need to scatter the points so that all the crimes are represented on the map, rather than the pins being stacked on top of each other (multiple points are located in the same position).
I have successfully imported xl tables of data (called school_detail_1818) into the gdb and added them to the map. Just in case xl was the problem, I have also converted them to dbf files which worked fine. A simple join works between the shapefile and the tables ok but I need something more sophisticated to display all the crimes and to scatter the points.
I have created a feature class (Parish_Points) from the points shapefile and successfully created a relationship class between that and the table. When I open the attribute table for the point feature class it shows the relationship ok.
It seems to be just sticking on the 'make query table', when I enter the SQL expression to match the parish names in the feature class with the table. The query I have built is:
"Parish_Points.PLA_corr" = "school_detail_1818.PLA"
When I click 'verify' I get the error message: 'An expected Field was not found or could not be retrieved properly [school_detail_1818]. Persisting in spite of the error message predictably means the query table fails to build. It must be a problem with that table. I have attached a screenshot showing the fields of the table. I can't immediately see a problem with it, but there must be one. 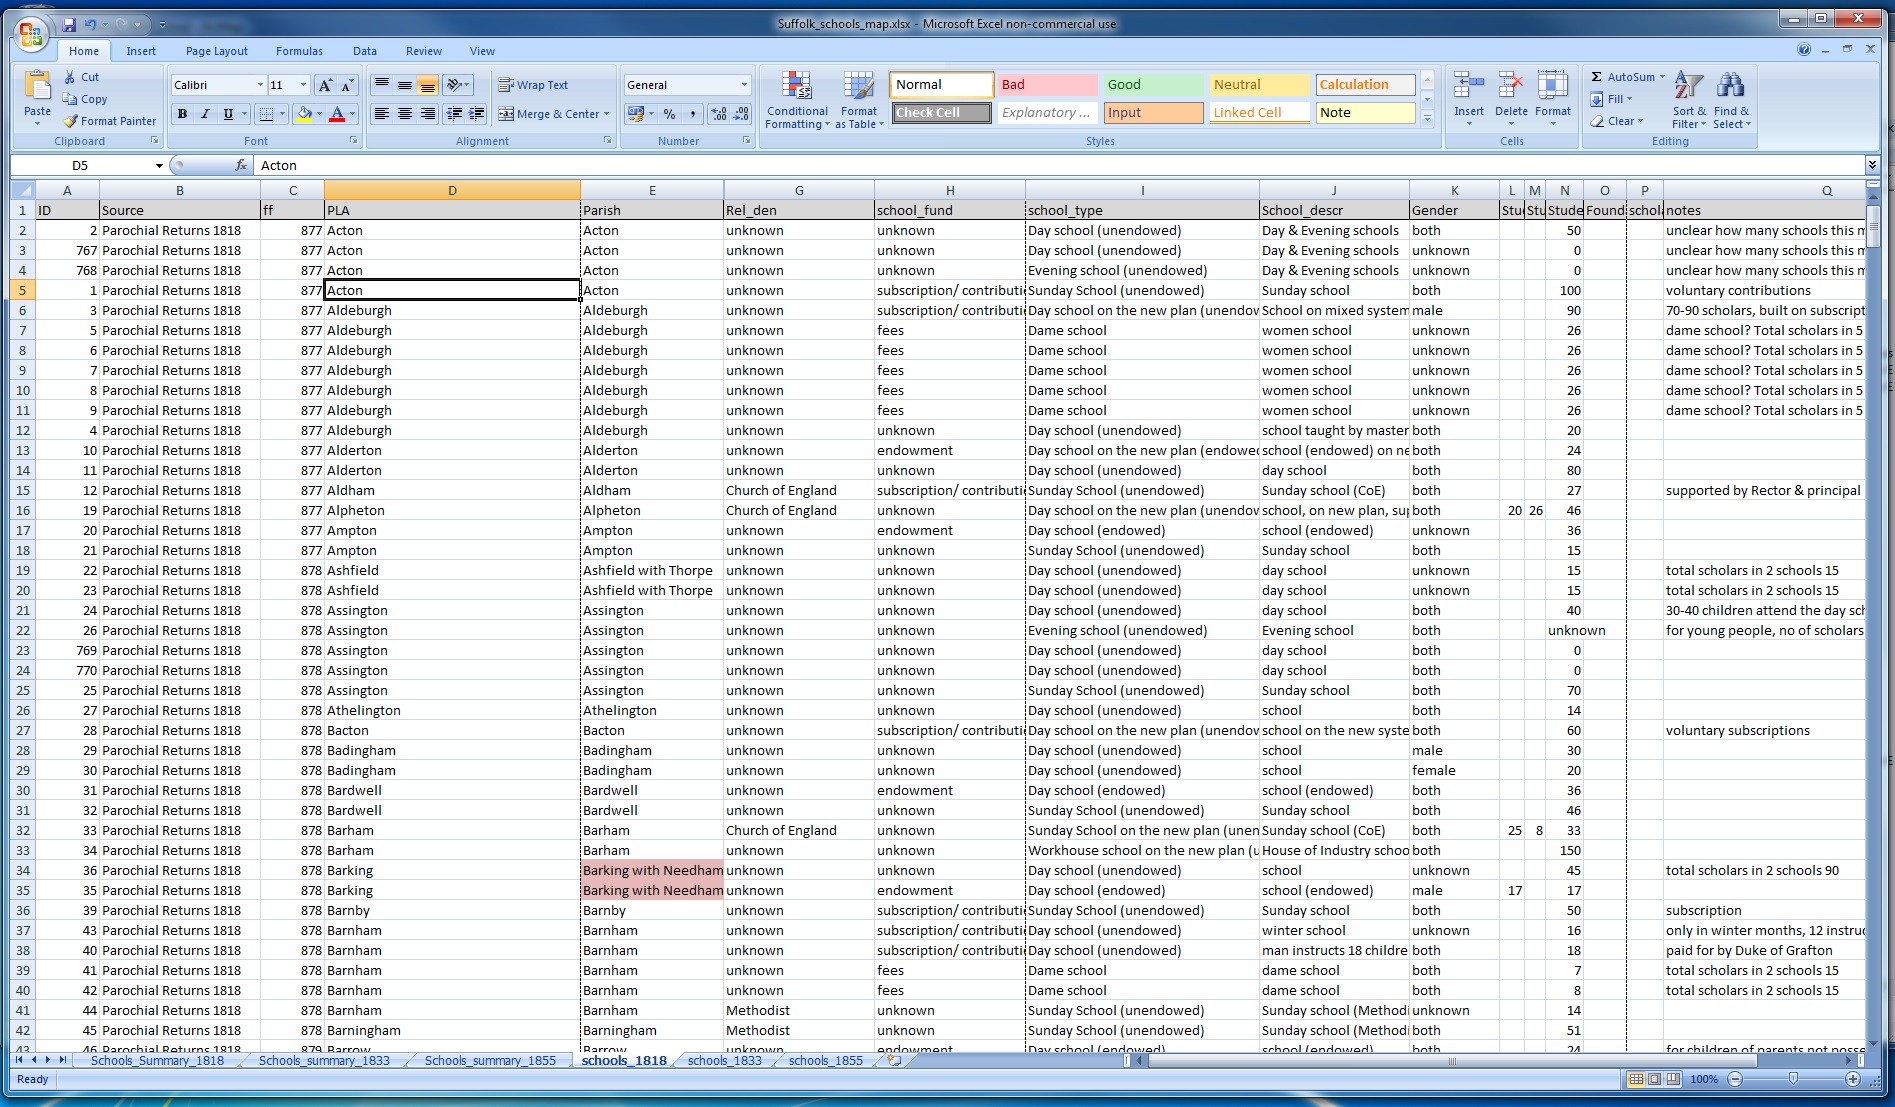
Many thanks again for your replies, very much appreciated!
Rosalind.
- Mark as New
- Bookmark
- Subscribe
- Mute
- Subscribe to RSS Feed
- Permalink
- Report Inappropriate Content
I think Helen may be right, and you need to get rid of the quote marks around the field name. I grew up in Suffolk, by the way! For some reason, I knew it would be Suffolk before I clicked on the screen shot and read the Parish names.
Have you considered that there might be better ways to display your data? One idea is to create a frequency summary of crimes by parish, and then display the parishes using a quantity symbology of either graduated colors or symbols. If you have different categories of crimes, another possibility is to arrange your data using a pivot table, so that you have columns of amounts for each crime type, and then use a bar chart symbology for each parish, showing the amounts of crimes in each category. Just some thoughts. Good luck!
- Mark as New
- Bookmark
- Subscribe
- Mute
- Subscribe to RSS Feed
- Permalink
- Report Inappropriate Content
Hi, I had *exactly* the same problem and I found the answer by accident:
When you do the SQL statement, it auto-adds speech marks around the column headers. It seems madness, but if you delete those quote marks it will work! Obviously there's a bug somewhere
All the best,
Hen
PS Just remembered, this blog post may help with getting the set up right: A Quick Tip on Performing a 1:M Join | Support Services Blog
- Mark as New
- Bookmark
- Subscribe
- Mute
- Subscribe to RSS Feed
- Permalink
- Report Inappropriate Content
Again, thanks everyone for your tips - which I have found extremely helpful.
Hen - you're right, this was the problem. At first it didn't seem to work, so I thought I should just run through what I did/ what happened in case any other newbie encounters the same issue.
1. I looked at my original tables xl tables again to see if I could make them any neater, in terms of field names and even unnecessary fields. I'm sure this didn't contribute to the fix, but probably a worthwhile exercise.
2. I re-imported my tables, and again converted them to dbf just in case xl was the problem (as it was a few years ago).
3. This was really important I think - I made sure again that my tables and feature classes were all stored in the same location - my personal geodatabase. (My geodatabase is stored inside a bigger folder which ArcCatalog connects to, and I think sometimes files get put in the level up (the folder) rather than the geodatabase. I also find the layout of ArcCatalogue slightly confusing at times - because there is the home folder at the top which has the maps and layers I have saved, and the geodatabase below under the list of connected folders which has the features, tables and relationship classes. Again - just in case that detail helps someone else who is stuck!)
4. I successfully created the relationship class between my point feature class and my dbf table. (Success shown by looking at the attribute table of the point feature class and seeing that the records had formed a relationship.)
5. I started the query table builder. When I got to the SQL expression, I made sure I removed the double quote marks. I clicked on verify and got the same frustrating error message. But after rechecking everything several times, decided to persist with building the query table anyway - and hey presto, it built successfully!
The blog page Hen pointed me to is super useful - and especially important is the instruction at the end to save the query table as a layer in the map.
Sephe - you are absolutely right too about thinking of different ways to display the data. Scattering points is not necessarily the most effective (and the resulting map looks a bit of a mess). So I'm going to try some of your suggestions to make it look better. I wanted to persist with scattering my pins because the next set of maps I want to create will hopefully show which parish a criminal lived in and which parish that same criminal committed a crime in. New challenges with that one - how to display multiple locations featured in the same row of a table at once, and then how to draw a line between these two points. I'm going to do some research on that to see if I can find an answer, but I may well be back for some more tips!
Thanks again everyone, I am very grateful!
Rosalind.