- Home
- :
- All Communities
- :
- Developers
- :
- Python
- :
- Python Questions
- :
- Re: Sum 6,000+ rasters - Python script
- Subscribe to RSS Feed
- Mark Topic as New
- Mark Topic as Read
- Float this Topic for Current User
- Bookmark
- Subscribe
- Mute
- Printer Friendly Page
Sum 6,000+ rasters - Python script
- Mark as New
- Bookmark
- Subscribe
- Mute
- Subscribe to RSS Feed
- Permalink
- Report Inappropriate Content
Hi there,
I am trying to sum close to 6,000 ESRI grids and found a piece of script on this forum that I have tried to adapt (attached). The script runs fine and prompts every grid but eventually crashes when it reaches the last raster. No output is created.
Would you have any idea as to why it crashes? The script seems to work fine when I test it on 5-10 grids. Could the reason be the 5,000 ESRI grid limit that can be stored in a single workspace directory (Esri Grid format—Help | ArcGIS for Desktop) ? I did try on less than 5,000 grids but had the same outcome.
I am using ArcGIS 10.2.2 and Python 2.7.5.
Thanks for your help!
Mathieu
- Mark as New
- Bookmark
- Subscribe
- Mute
- Subscribe to RSS Feed
- Permalink
- Report Inappropriate Content
I agree with Xander Bakker that the dashes in the file path may be an issue. Maybe try using a different folder structure that does not have dashes?
A general suggestion. With Grid files, shorter is usually better in terms of paths and filenames. Oftentimes if the combined length of filename and path is long, there can be issues. Yet the same process will often work fine if the path is simplified to be very short. In theory it shouldn't matter, but there can be a difference. So try a shorter path, that may resolve it.
ArcGIS Help (10.2, 10.2.1, and 10.2.2) - ESRI Grid format
Chris Donohue, GISP
- Mark as New
- Bookmark
- Subscribe
- Mute
- Subscribe to RSS Feed
- Permalink
- Report Inappropriate Content
Your computer might not have enough memory. As Xander Bakker states, try smaller chunks of rasters.
- Mark as New
- Bookmark
- Subscribe
- Mute
- Subscribe to RSS Feed
- Permalink
- Report Inappropriate Content
Hi Mathieu
I would also recommend trying the FGDB ideas given above. And if Xander Bakker's good looking code doesn't do the trick, I have some further options that might be worthy to check out. We ran into similar problems at work while processing a large number of (raster)data in Python scripts. The following helped us solving similar issues as you are currently experiencing:
Monitor your computers memory while the tool runs using Task Manager. Should there be a memory issue, or if the above ideas using the FGDB does not work try the following:
- Write a .BAT file that accesses the Python.exe and then opens your script. Insert all the necessary arguments in the command line script. You can prepare the batches using an Editor or Excel.
- This way you'll be able to process a large number of iterations of your script outside the ArcCatalog environment, which (in case there are any in the first place) would solve the memory issues, because running a BAT-script means that the Python environment is closed after each iteration and loaded again for the next.
Hope this helps.
- Mark as New
- Bookmark
- Subscribe
- Mute
- Subscribe to RSS Feed
- Permalink
- Report Inappropriate Content
If the nodata value is the same in all rasters, why are you having to produce a set of new rasters reclassifying them to zero?
perhaps you coul
- Load a raster
- RasterToNumPyArray to convert raster to array
- convert nodata to zero
- repeat for X rasters
- sum or whatever
- save intermediate to file using NumpyArrayToRaster OR just save the array to disk
- repeat for X more
- take all the X grids and add them all together either in arcmap if save as rasters or reload and sum/whatever the saved arrays
NumPy arrays are nice and clean, the only problem would depend on the size of the rasters and how much memory you have.
- Mark as New
- Bookmark
- Subscribe
- Mute
- Subscribe to RSS Feed
- Permalink
- Report Inappropriate Content
Good news on the script, it seems to be running although the output isn't correct.
Here are the modifications I made from your suggestions guys (based on Xander's script):
- shorter paths ;
- delete the dashes, replace by underscores ;
- point 'res_ws' to a folder instead of a geodatabase ;
Tiff or ESRI grid, it doesn't seem to make much difference although the Tiff appears more stable. The initial issue happened when writing the first raster to the fgdb.
I can see the various cellstat1, cellstat2... and the total_sum so it is processing the rasters. Unfortunately, the output is a grid comprised between -3.40282e+038 and 3.40282e+038. This is likely due to the way NoData is handled. The parameter of CellStatistics being ''DATA", it shouldn't take the NoData into account in the calculation. One way of dealing with this would be to convert NoData to 0 but given that the data is temperature, it doesn't make scientific sense to attribute a zero as I will be calculating the mean eventually.
I have attached a few files in their original format (txt).
- Mark as New
- Bookmark
- Subscribe
- Mute
- Subscribe to RSS Feed
- Permalink
- Report Inappropriate Content
From your sample of 5 days, I got this
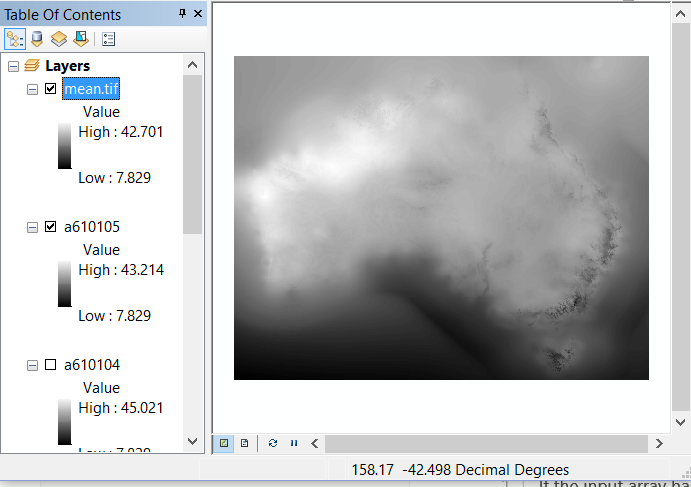
or in color

From directly reading the *.txt files, creating an array stack and determining the average along the time axis (2nd)
for the whole 5 day stack I got
print("Avg {:8.3} Min {:8.3}, Max {:8.3}".format(s.mean(),s.min(),s.max()))
Avg 26.6 Min 7.83, Max 46.4
I found no, nodata values. If this were true of all the data, AND they were perfectly aligned, this would be a dream. Even if there were nodata, you can easily account for it and if they weren't aligned, it could be done for a window of common area.
The arrays are very small. If you have a year's worth of ascii files you could zip, I would love to give it a test run.
- Mark as New
- Bookmark
- Subscribe
- Mute
- Subscribe to RSS Feed
- Permalink
- Report Inappropriate Content
- Mark as New
- Bookmark
- Subscribe
- Mute
- Subscribe to RSS Feed
- Permalink
- Report Inappropriate Content
Hi Dan,
I did check for the data and the licence does not allow for external use, sorry. But I am sure if you modify the shape you won't have any issues...
The avi file was an excellent idea, I don't use time visualisation very often but I should.
Please let me know when you have a change to share the script, I am looking forward to trying on more files!
Cheers,
- Mark as New
- Bookmark
- Subscribe
- Mute
- Subscribe to RSS Feed
- Permalink
- Report Inappropriate Content
This thread has been branched to 6,000+ rasters the follow-up
for more on raster conversion and temporal data.
- « Previous
- Next »
- « Previous
- Next »