- Home
- :
- All Communities
- :
- Products
- :
- Geoprocessing
- :
- Geoprocessing Questions
- :
- Re: DISTANCE MATRIX between 30 points
- Subscribe to RSS Feed
- Mark Topic as New
- Mark Topic as Read
- Float this Topic for Current User
- Bookmark
- Subscribe
- Mute
- Printer Friendly Page
DISTANCE MATRIX between 30 points
- Mark as New
- Bookmark
- Subscribe
- Mute
- Subscribe to RSS Feed
- Permalink
- Report Inappropriate Content
Is there a way to generate a matrix of distances between points like the way one could do with Hawths Analysis tool using ArcGIS 9.3? Hawths tool is not supported in ArcGIS 10.x. I am using ArcGIS 10.5
- Mark as New
- Bookmark
- Subscribe
- Mute
- Subscribe to RSS Feed
- Permalink
- Report Inappropriate Content
Perhaps Generate Near Table—Help | ArcGIS Desktop could work followed by Pivot Table—Help | ArcGIS Desktop (or do this in Excel).
- Mark as New
- Bookmark
- Subscribe
- Mute
- Subscribe to RSS Feed
- Permalink
- Report Inappropriate Content
Or if you lack the license level Generate Near Table for points
- Mark as New
- Bookmark
- Subscribe
- Mute
- Subscribe to RSS Feed
- Permalink
- Report Inappropriate Content
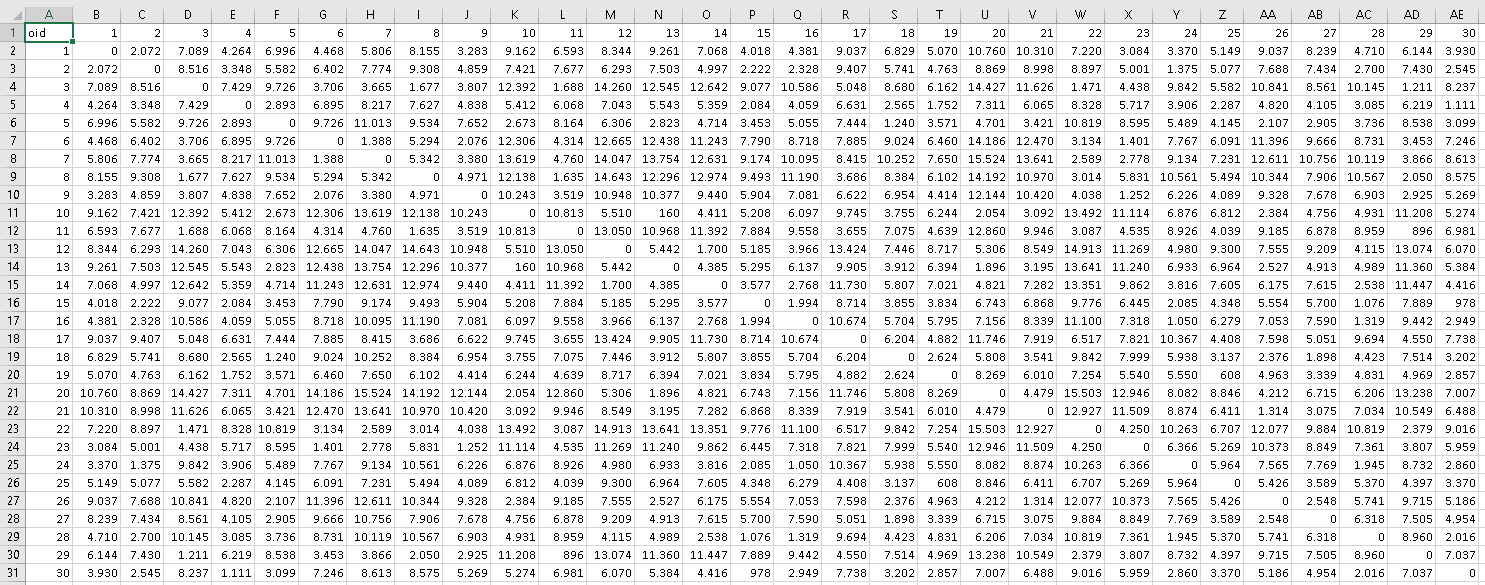
See below the result of the script posted further down (after pasting the data into Excel):
Code used:
def main():
import arcpy
import random
arcpy.env.overwriteOutput = True
# create a featureclass with 30 random points
fc = r'C:\GeoNet\NearMatrix\data.gdb\points'
sr = arcpy.SpatialReference(3857)
x_range = [-8418055, -8408208]
y_range = [689582, 705039]
num_points = 30
feats = []
for cnt in range(30):
x = random.randrange(x_range[0], x_range[1])
y = random.randrange(y_range[0], y_range[1])
pntg = arcpy.PointGeometry(arcpy.Point(x, y), sr)
feats.append(pntg)
arcpy.CopyFeatures_management(feats, fc)
# analyze points and create matrix
flds = ('OID@', 'SHAPE@')
dct_pnts = {r[0]: r[1] for r in arcpy.da.SearchCursor(fc, flds)}
dct_res = {}
oids = sorted(dct_pnts.keys())
for oid_from in oids:
dct_i = {}
for oid_to in oids:
if oid_from == oid_to:
dist = 0
else:
dist = dct_pnts[oid_from].distanceTo(dct_pnts[oid_to])
dct_i[oid_to] = dist
dct_res[oid_from] = dct_i
# print the result
print 'oid\t', '\t'.join([str(a) for a in oids])
for oid in oids:
dct_i = dct_res[oid]
print oid, '\t', '\t'.join([str(dct_i[a]).replace('.', ',') for a in oids])
if __name__ == '__main__':
main()In this case the part until line 20 is to create a featureclass with 30 random points in it (using a projected coordinate system).
Lines 22 to 36 are used to loop through the points and determine the distance between them. In this case the distance between each point pair is calculated twice (both directions) and could be enhanced.
Lines 38 to 42 is used to print the data with TAB as separator and in my case line 42 contains an additional ".replace('.', ',')" to change the decimal sign from point to comma.
The printed code was copied from the intermediate window and pasted in Excel and that's basically all there is to it.
- Mark as New
- Bookmark
- Subscribe
- Mute
- Subscribe to RSS Feed
- Permalink
- Report Inappropriate Content
Details of einsum (as e_dist) and art.frmt_ in blogs. If a featureclass is needed, then two more columns (X and Y) can be inserted
# ---- create 10 random points, 'a' 10 and produce a distance matrix ----
#
a = np.random.randint(0, 10, size=(10,2))
b = a.reshape(np.prod(a.shape[:-1]), 1, a.shape[-1]) # magic 1
diff = a - b
dist_arr = np.einsum('ijk,ijk->ij', diff, diff) # magic 2, einsum distance
dist_arr = np.sqrt(dist_arr).squeeze()
#
# ---- also available in scipy as cdist ----
#
art.frmt_(dist_arr, deci=2, title='Distance matrix...')
#
Distance matrix......
-shape (1, 10, 10), ndim 3
. 0.00 1.41 5.10 7.62 8.60 8.49 5.39 2.00 6.08 5.00
. 1.41 0.00 6.00 8.94 10.00 9.90 6.71 3.16 7.00 6.08
. 5.10 6.00 0.00 8.25 6.32 7.07 6.71 5.83 1.00 1.00
. 7.62 8.94 8.25 0.00 4.47 3.16 2.24 5.83 8.54 7.28
. 8.60 10.00 6.32 4.47 0.00 1.41 5.00 7.62 6.08 5.39
. 8.49 9.90 7.07 3.16 1.41 0.00 4.12 7.21 7.00 6.08
. 5.39 6.71 6.71 2.24 5.00 4.12 0.00 3.61 7.21 5.83
. 2.00 3.16 5.83 5.83 7.62 7.21 3.61 0.00 6.71 5.39
. 6.08 7.00 1.00 8.54 6.08 7.00 7.21 6.71 0.00 1.41
. 5.00 6.08 1.00 7.28 5.39 6.08 5.83 5.39 1.41 0.00 The featureclass can be constructed as follows... done verbosely
# ---- construct a data type so that the data can be sent to a featureclass ----
dt0 = [('X', '<f8'), ('Y', '<f8')]
dt1 = [('p{}'.format(i), '<f8') for i in range(len(a))]
dt = dt0 + dt1
#
b = np.c_[a, dist_arr] # combine coordinates and data
out = np.zeros((len(b),), dtype=dt) # prepare a structured array to fill
names = out.dtype.names
for i in range(b.shape[1]):
out[names[i]] = b[:, i]
# ---- off to a shapefile or featureclass
arcpy.da.NumPyArrayToFeatureClass(out, r'c:\temp\test.shp', ['X', 'Y'])Of course, helper functions (and a module with these) make these steps greatly reduced.