- Home
- :
- All Communities
- :
- Products
- :
- ArcGIS Spatial Analyst
- :
- ArcGIS Spatial Analyst Questions
- :
- Re: Zonal Statistics as Table Not Working
- Subscribe to RSS Feed
- Mark Topic as New
- Mark Topic as Read
- Float this Topic for Current User
- Bookmark
- Subscribe
- Mute
- Printer Friendly Page
Zonal Statistics as Table Not Working
- Mark as New
- Bookmark
- Subscribe
- Mute
- Subscribe to RSS Feed
- Permalink
- Report Inappropriate Content
I am trying to run the Zonal Statistics as Table tool on my data in order to sum the number of cells of a certain type of landcover in each county. For example, I want it to sum how many Deciduous forest, Pasture/Hay land and etc.. there are in each county individually.
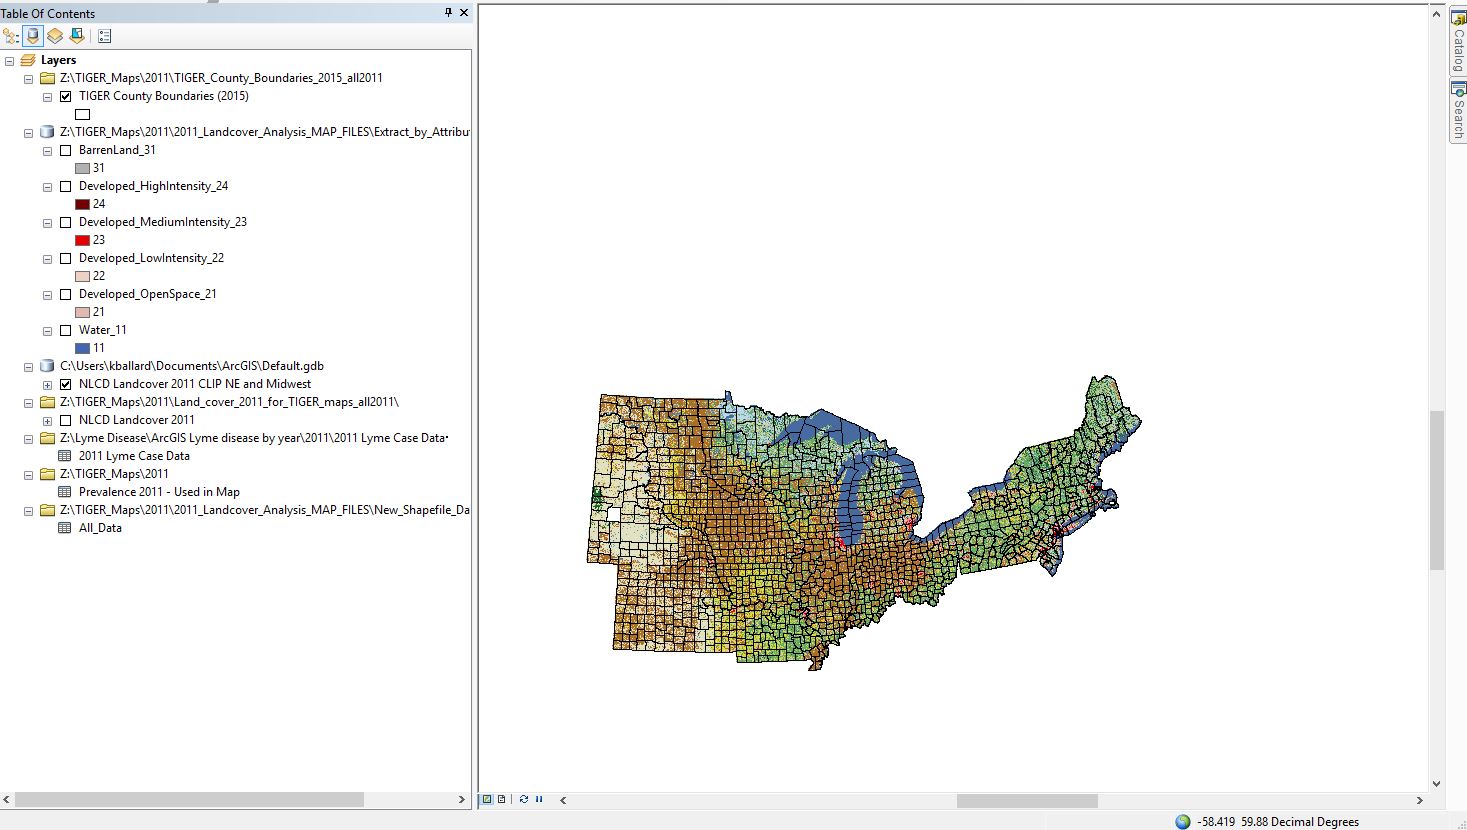

I have tried two different ways: 1. By using the Extract by Attributes tool on the raster to extract each individual type of cell (so, one raster is created for deciduous forest cells and one raster for paster/hay and etc...), then running the zonal statistic on each of those one at a time (not sure if this is necessary or not). 2. By just running the Zonal statistics as Table tool on the full raster.
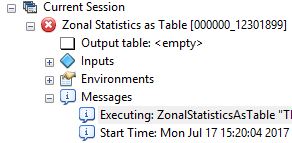
I have tried EVERYTHING (saving it in a personal geodatabase, saving it in a file, getting rid of spaces in file names, making sure zone feature name is less than 17 characters etc...) and I still keep getting either "ERROR 999999" or there is no error at all under messages or even an indication that it has stopped, instead the red X circle just appears next to
it with no message. I attached a screenshot of what that second occurrence looks like.
Does anyone have any idea what I might be able to do to make this tool work? And do I need to be performing the "Extract by Attributes" tool or should the Zonal Statistics tool be able to sum up each type of cell (e.i. deciduous forest, developed land etc..) individually in each county?
- Mark as New
- Bookmark
- Subscribe
- Mute
- Subscribe to RSS Feed
- Permalink
- Report Inappropriate Content
That is correct. Converting a polygon to a raster is going to show this behaviour if you zoom in close enough, and as Xander points out, you can gain control over the cell size of the conversion by doing the conversion prior to performing any further analysis. Processing Environments should always be considered and set before doing any sort of analysis. Unfortunately the 'Environments' button is way at the bottom right of all the tools in Arctoolbox in the region 'obscurata'... at least in ArcGIS Pro.. Environments is placed on an equal footing on the top of all tool dialog. Never assume... especially when working with rasters... by default the cell size is 1/250th the largest of the extent (width or height)... but what if you want a cell size of 10 m? isn't going to happen unless you set it before doing your work.
- Mark as New
- Bookmark
- Subscribe
- Mute
- Subscribe to RSS Feed
- Permalink
- Report Inappropriate Content
From the Help:
If the zone input is a feature dataset, a vector-to-raster conversion will be internally applied to it.
The tool will not allow you to control it. As an alternative you could convert the zones to raster first using Polygon to Raster—Help | ArcGIS Desktop. This allow some control over the cell assignment, but not that it will only use the cells that are completely inside a polygon. You could, convert the raster representation to vector again, do a spatial select and work on that, but please understand that your statistics will be off since pixels that are shared by two zones will not be taking into account.
- Mark as New
- Bookmark
- Subscribe
- Mute
- Subscribe to RSS Feed
- Permalink
- Report Inappropriate Content
Disable background processing and try again.
Think Location
- Mark as New
- Bookmark
- Subscribe
- Mute
- Subscribe to RSS Feed
- Permalink
- Report Inappropriate Content
Dan Patterson and Jayanta Poddar hit the highlights of what can go awry with this sort of process.
Setting up the data is crucial and often requires a different method of file naming and structuring than with most other types of GIS processing. Oftentimes this will involve unique data and folder set up before running the process to help ensure the processing will work:
- No spaces or restricted characters in the file names nor the folder names. So no spaces, no parenthesis. For example, the input file TIGER County Boundaries (2015) will need the spaces and parenthesis removed.
- Keep the path to the data short. While technically one can put the data out several folders in a path, in reality this can cause processes to crash.
- Keep filenames very short. As a general rule, I'd shoot for 8 characters or less. They can always be renamed later.
- Avoid using network drives if possible. Your hard drive is the best way to go if you have access to it and available space.
- Try putting the data into a simple folder, like C:\Data
- In regards to the Joined data, save off the Joined data to a new feature class (Data, Export Data) and run the process on that new feature class.
- "Disable Background processing" often is the cure when otherwise everything else seems set up OK.
Chris Donohue, GISP
- Mark as New
- Bookmark
- Subscribe
- Mute
- Subscribe to RSS Feed
- Permalink
- Report Inappropriate Content
Thank you all for the help! It's working now. It seems the length of the filenames and the joined table were the problems.
It appears that I cannot run the Zonal Statistics as table tool and have it sum up each cell type individually (for example number of deciduous cells in each county, number of coniferous cells etc in each county). Instead it just seems to sum all the cells together.
The only fix I know for this is to run Extract by Attributes for each cell type (which takes a very long time), then performing the Zonal Statistics tool on each one. Does anyone know of a tool that could allow me to do this in a more efficient way, or to select that I want a sum of each type of cell individually?
Thank you!
- Mark as New
- Bookmark
- Subscribe
- Mute
- Subscribe to RSS Feed
- Permalink
- Report Inappropriate Content
To gather the Zonal Statistics on a County-by-County basis one will likely have to employ either Modelbuilder or Python to loop through each county and do a Zonal Statistics run on just that county.
For Modelbuilder, the looping would be via an Iterator
- What is ModelBuilder?—Help | ArcGIS for Desktop
- Example of using an iterator in a model—Help | ArcGIS for Desktop
- Accessing iterators in ModelBuilder—Help | ArcGIS for Desktop
Note that one can carry over some of the information to be used in the file naming via the use of In-line Variable Substitution. For example, with this process as each county is run the County name (or other information) could be added as part of the output file name for each result to make each output more easily recognizable.
A quick tour of using inline variable substitution—Help | ArcGIS for Desktop
If you are familiar with Python, there are a variety of looping methods.
Chris Donohue, GISP
- Mark as New
- Bookmark
- Subscribe
- Mute
- Subscribe to RSS Feed
- Permalink
- Report Inappropriate Content
Sorry, I don't think I explained very well. I actually got the tool to work (summing for each individual county) by just associating it with a code in the shapefile that was unique to each county. My issue is that in the raster there are different types of cells (blue cells = water (11), dark green cells = evergreen forests (42) and etc). I basically am using the Zonal Statistics as Table tool to tell me how many water cells there are in each county, how many evergreen forest cells in each county and so on. So far, the only way that I can find to have it sum water cells and evergreen forest individually, rather than just summing all cells in each county, is to first use "Extract by Attributes" to make an individual raster for each landcover type (so a raster showing only water cells, a raster showing only evergreen forest cells, etc..) Then running the Zonal Stat as table tool on each one of these separately. I'm wondering if there is an add-on or other tool that would allow me to tell the Zonal statistic tool to sum by cell type? Unfortunately I'm not trained in Python.
My other question is, I want to tell the Zonal Stat tool to only count cells that are completely inside a county, not ones that are only half inside a county (like the cell is split by the county boundary so only half the cell falls in the county). However, I do not see an option for this in the Zonal Stat tool window. Does anyone know a way that I could accomplish this?
Thank you!
- « Previous
-
- 1
- 2
- Next »
- « Previous
-
- 1
- 2
- Next »