- Home
- :
- All Communities
- :
- Developers
- :
- Python
- :
- Python Questions
- :
- Re: arcgis cellstatistics (range) error
- Subscribe to RSS Feed
- Mark Topic as New
- Mark Topic as Read
- Float this Topic for Current User
- Bookmark
- Subscribe
- Mute
- Printer Friendly Page
- Mark as New
- Bookmark
- Subscribe
- Mute
- Subscribe to RSS Feed
- Permalink
- Report Inappropriate Content
I want to calculate the range sequence, the Python script as follow:
- #ndvi_R = CellStatistics(RList, "RANGE", "DATA")the results are 0, but when I run as follows, it's correct.
- ndvi_MAX = CellStatistics(RList, "MAXIMUM", "DATA")
ndvi_MIN = CellStatistics(RList, "MINIMUM", "DATA")
ndvi_R = ndvi_MAX - ndvi_MIN
Solved! Go to Solution.
Accepted Solutions
- Mark as New
- Bookmark
- Subscribe
- Mute
- Subscribe to RSS Feed
- Permalink
- Report Inappropriate Content
this weirdness with cell statistics has been reported before
https://community.esri.com/thread/179829
I will look at the rasters, but I suspect it is a nodata issue, an extent issue or similar related environment properties
EDIT
- I can confirm that the problem remains if the inputs are 32bit tiffs or 32 bit esri grids
- Your workaround does the the job.
- I haven't gone to the effort of converting to a lower bit level... that could be a task for someone else.
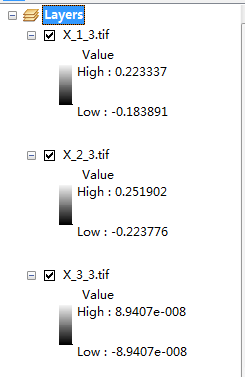
- your band 3 is pretty strange... calculate statistics, try viewing without a stretched symbology and have a look at its histogram
- try scaling the values to integer (ie Int('band1'*100) ) then determining the range
I would file a case with tech support, especially in light of esri's default grid format being tiffs in recent versions.
- Mark as New
- Bookmark
- Subscribe
- Mute
- Subscribe to RSS Feed
- Permalink
- Report Inappropriate Content
check your rlist since 0 is expected under one circumstance. Your workaround is fine.. perhaps you have a nodata value in one of the rasters... too hard to tell from your description
For statistic types Maximum, Minimum, Mean, Median, Majority, Minority and Sum, if a single raster is used as the input, the output cell values will be the same as the input cell values. For Range and STD the output cell values will all be 0, and for Variety, all 1.
- Mark as New
- Bookmark
- Subscribe
- Mute
- Subscribe to RSS Feed
- Permalink
- Report Inappropriate Content
- Thanks for your help, I calculate one RList as follows alone, but the results are still 0. If it exists a nodata value, the parameter ‘DATA’ was explained in the arcgis help.
- DATA —At the processing cell location, if any of the input rasters has NoData, then that NoData value will be ignored. The statistics will be computed by only considering the cells with valid data. This is the default.
- I have attached the RList:ndvi_R.zip - Google Drive
- Mark as New
- Bookmark
- Subscribe
- Mute
- Subscribe to RSS Feed
- Permalink
- Report Inappropriate Content
this weirdness with cell statistics has been reported before
https://community.esri.com/thread/179829
I will look at the rasters, but I suspect it is a nodata issue, an extent issue or similar related environment properties
EDIT
- I can confirm that the problem remains if the inputs are 32bit tiffs or 32 bit esri grids
- Your workaround does the the job.
- I haven't gone to the effort of converting to a lower bit level... that could be a task for someone else.
- your band 3 is pretty strange... calculate statistics, try viewing without a stretched symbology and have a look at its histogram
- try scaling the values to integer (ie Int('band1'*100) ) then determining the range
I would file a case with tech support, especially in light of esri's default grid format being tiffs in recent versions.
- Mark as New
- Bookmark
- Subscribe
- Mute
- Subscribe to RSS Feed
- Permalink
- Report Inappropriate Content
Thanks. I have checked my RList seriously and removed the 'X_3_3.tif', but the problem still exists. Finally, I scaled the values to integer (Int("X_2_3.tif" * 100)) then determining the range, it works. Thank you for your patience and help.
- Mark as New
- Bookmark
- Subscribe
- Mute
- Subscribe to RSS Feed
- Permalink
- Report Inappropriate Content
glad it worked... I suspect this issue will arise again... bookmarking