- Home
- :
- All Communities
- :
- Products
- :
- 3D
- :
- 3D Questions
- :
- Re: Convert 3D points to 3D lines (underground wel...
- Subscribe to RSS Feed
- Mark Topic as New
- Mark Topic as Read
- Float this Topic for Current User
- Bookmark
- Subscribe
- Mute
- Printer Friendly Page
Convert 3D points to 3D lines (underground well data)
- Mark as New
- Bookmark
- Subscribe
- Mute
- Subscribe to RSS Feed
- Permalink
- Report Inappropriate Content
I am trying to convert the measured 3D points data into 3D lines. The data is underground vertical well data. When I am converting from points to line the conversion process is failing to capture the Z values and the lines are being drawn on the surface horizontally. I can understand the issue but I am not sure how to solve it. Any suggestions would be helpful.
Thank you.
Solved! Go to Solution.
- Mark as New
- Bookmark
- Subscribe
- Mute
- Subscribe to RSS Feed
- Permalink
- Report Inappropriate Content
Xander,
- you are correct, there are two wells
- bh_long and bh_lat represents the longitude and latitude in decimal degress.
- Z values are the neg values of measdpth
- The field that indicates the order is also the measdpth. Measurements were made at various depths, so the order will be the top most depth to the deepest depth.
- The units are in feet.
- Mark as New
- Bookmark
- Subscribe
- Mute
- Subscribe to RSS Feed
- Permalink
- Report Inappropriate Content
This is the code that you could use to convert the csv into a 3D polyline:
def main():
    import csv
    import arcpy

    # input csv
    csv_path = r"C:\Forum\3Dpnts_3Dlines\SampleData_well.csv"
    fld_x = 'bh_long'
    fld_y = 'bh_lat'
    fld_z = 'Z'
    fld_order = 'measdpth'
    fld_lineid = 'api_wellno'

    # settings
    sr = arcpy.SpatialReference(4326) # WGS_1984
    arcpy.env.overwriteOutput = True
    feetinmeter = 0.3048

    # output featureclass (could also point to fc in fgdb)
    fc = r"C:\Forum\3Dpnts_3Dlines\shp\test01.shp"

    lineids = []
    dct = {}
    # read csv
    with open(csv_path, 'rb') as f:
        reader = csv.reader(f)
        cnt = 0
        for row in reader:
            cnt += 1
            if cnt == 1:
                # header
                header = row
            else:
                # read fields from data
                lineid = row[header.index(fld_lineid)]
                x = float(row[header.index(fld_x)])
                y = float(row[header.index(fld_y)])
                z = float(row[header.index(fld_z)]) * feetinmeter

                # create point object with XYZ
                pnt = arcpy.Point(x, y, z)

                # read order and create string to sort on (lineid + order)
                order = row[header.index(fld_order)]
                srt =  "{0}_{1}".format("%04d" % (int(lineid),),
                      "{0}".format(round(float(order), 1)).zfill(8))

                # create nested dictionary with points per line
                if lineid in dct:
                    dct[lineid][srt] = pnt
                else:
                    dct[lineid] = {}
                    dct[lineid][srt] = pnt

    # create polylines
    lst_polylines = []
    for lineid, dct2 in dct.items():
        lst_pnt = []
        for srt, pnt in sorted(dct2.items()):
            lst_pnt.append(pnt)
        polyline = arcpy.Polyline(arcpy.Array(lst_pnt), sr, True, False)
        lst_polylines.append(polyline)

    # write polylines to output featureclass
    arcpy.CopyFeatures_management(lst_polylines, fc)

if __name__ == '__main__':
    main()
- Mark as New
- Bookmark
- Subscribe
- Mute
- Subscribe to RSS Feed
- Permalink
- Report Inappropriate Content
Xander,
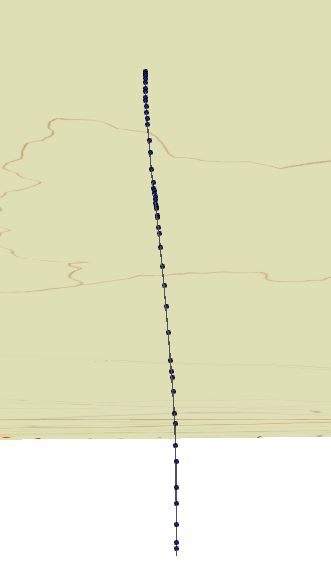
Thank you very much. The code is working great. I just made minor changes to the code. I removed the conversion factor to fit to my requirements. The output is decent and satisfactory to most extent. when the line curvature exists the points and the line doesnt align properly though.
- Mark as New
- Bookmark
- Subscribe
- Mute
- Subscribe to RSS Feed
- Permalink
- Report Inappropriate Content
A small explanation of what is going on, on line 44 and 45:
srt =  "{0}_{1}".format("%04d" % (int(lineid),),
       "{0}".format(round(float(order), 1)).zfill(8))
It creates a string combining the lineid (e.g. 102) and the order (e.g. 5482.0) into a string that will be used as key for the dictionary. The dictionary is sorted on key (see line 58) and the string "srt" will have a value like: "0102_005482.0". This allows to sort on line and per line on order.
See also: Some Python Snippets
- Mark as New
- Bookmark
- Subscribe
- Mute
- Subscribe to RSS Feed
- Permalink
- Report Inappropriate Content
I am trying understand this code. When i apply the same code with slight modifications to different set of data. It isn't working correctly. The new data has a lineID of 14 characters and the order varying from 3 to 5 characters.
- Mark as New
- Bookmark
- Subscribe
- Mute
- Subscribe to RSS Feed
- Permalink
- Report Inappropriate Content
if the lineid is always 14 characters, or if it is not numerical you could simply do this:
srt =  "{0}_{1}".format(lineid,
      "{0}".format(round(float(order), 1)).zfill(8))
It is probably not important in which order the lines are processed. What is important is the order of the points per line being processed.
- Mark as New
- Bookmark
- Subscribe
- Mute
- Subscribe to RSS Feed
- Permalink
- Report Inappropriate Content
Xander,
Whoop! Its not the code I had problem with. its the format of my CSV columns. After fixing that issue everything looks great. Thank you very much Xander for all your help.
- Mark as New
- Bookmark
- Subscribe
- Mute
- Subscribe to RSS Feed
- Permalink
- Report Inappropriate Content
Glad it works now. The fields are hard coded...
- « Previous
-
- 1
- 2
- Next »
- « Previous
-
- 1
- 2
- Next »