Turn on suggestions
Auto-suggest helps you quickly narrow down your search results by suggesting possible matches as you type.
Cancel
- Home
- :
- All Communities
- :
- Products
- :
- ArcGIS Dashboards
- :
- ArcGIS Dashboards Ideas
- :
- Serial Chart - Multiple grouped date fields
Options
- Subscribe to RSS Feed
- Mark as New
- Mark as Read
- Bookmark
- Follow this Idea
- Printer Friendly Page
- Report Inappropriate Content
- Mark as New
- Bookmark
- Subscribe
- Mute
- Subscribe to RSS Feed
- Permalink
- Report Inappropriate Content
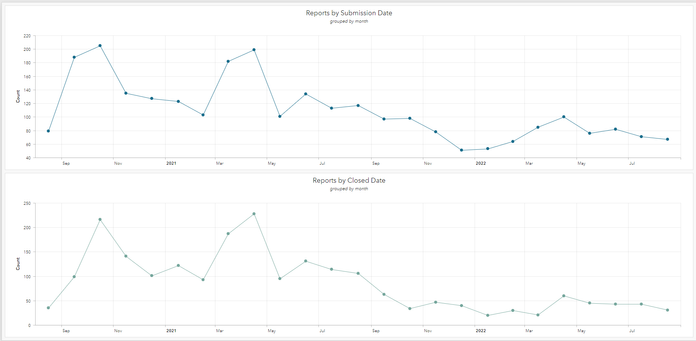
We'd like to be able to show on the same chart the number of new reports and number of closed reports by month - ideally with the source data.
Right now - it seems like we have to create two charts, which can be difficult to understand whether the new and closed are keeping up with each other or are we getting behind month to month or week to week.
It'd be awesome to have an option to do a date based chart with multiple date fields contributing to multiple series.
You must be a registered user to add a comment. If you've already registered, sign in. Otherwise, register and sign in.
