- Home
- :
- All Communities
- :
- Products
- :
- ArcGIS Experience Builder
- :
- ArcGIS Experience Builder Questions
- :
- Build an Indicator Table list
- Subscribe to RSS Feed
- Mark Topic as New
- Mark Topic as Read
- Float this Topic for Current User
- Bookmark
- Subscribe
- Mute
- Printer Friendly Page
- Mark as New
- Bookmark
- Subscribe
- Mute
- Subscribe to RSS Feed
- Permalink
- Report Inappropriate Content
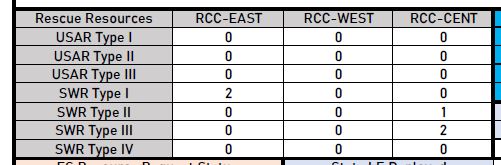
I am new to Experience builder. I am attempting to display a table of Counts from a Feature Layer similar to the Photo Attached. Basically I want to look at the Data and give a Total Count of the Items that meet those Types. How do I build a table that dynamically changes base on the inputs to the layer?
Solved! Go to Solution.
Accepted Solutions
- Mark as New
- Bookmark
- Subscribe
- Mute
- Subscribe to RSS Feed
- Permalink
- Report Inappropriate Content
Experience Builder does not provide a statistics function in the Table widget. There are couple of walkarounds that may help achieve the function:
1. Add a Chart widget to calculate the statistics. Use the chart output data as the data source of the table sheets.
- Add a chart and select Statistics as Count
- Create a new sheet in the Table widget, and select Chart statistics output view


It will give you a table of counts from selected categories in the Chart widget. But the field name cannot be customized and it can only show one field count in each sheet.
2. Create data views with predefined filters and use Dynamic content in the Text widget.
- Go to the data you would like to calculate statistics and create separate data views
- Add Text widgets and connect to the data views


- Use Dynamic content to calculate the count

To make the layout pretty, you can use layout widgets like Card, Row/Column/Grid to organize your titles and count texts. Here is an example that I created using Row/Column widgets to organize the layout:

- Mark as New
- Bookmark
- Subscribe
- Mute
- Subscribe to RSS Feed
- Permalink
- Report Inappropriate Content
Sounds like you might be able to do it with a Data Expression which is a great way to present summarized data. However, I don't know if the table component in a EB application has the option to use a Data Expression source. The dashboards do. Here's a link that will give you more insight:
Introducing Data Expressions in ArcGIS Dashboards (esri.com)
- Mark as New
- Bookmark
- Subscribe
- Mute
- Subscribe to RSS Feed
- Permalink
- Report Inappropriate Content
Experience Builder does not provide a statistics function in the Table widget. There are couple of walkarounds that may help achieve the function:
1. Add a Chart widget to calculate the statistics. Use the chart output data as the data source of the table sheets.
- Add a chart and select Statistics as Count
- Create a new sheet in the Table widget, and select Chart statistics output view
It will give you a table of counts from selected categories in the Chart widget. But the field name cannot be customized and it can only show one field count in each sheet.
2. Create data views with predefined filters and use Dynamic content in the Text widget.
- Go to the data you would like to calculate statistics and create separate data views
- Add Text widgets and connect to the data views
- Use Dynamic content to calculate the count
To make the layout pretty, you can use layout widgets like Card, Row/Column/Grid to organize your titles and count texts. Here is an example that I created using Row/Column widgets to organize the layout:
- Mark as New
- Bookmark
- Subscribe
- Mute
- Subscribe to RSS Feed
- Permalink
- Report Inappropriate Content
Thanks, Number 2 seems to be a great option. Just to confirm, I would need 21 Views to accomplish the below chart.

- Mark as New
- Bookmark
- Subscribe
- Mute
- Subscribe to RSS Feed
- Permalink
- Report Inappropriate Content
Based on the provided table, each value necessitates a view, resulting in a total of 21 views. Additionally, creating data views while connecting data can save time as it eliminates the need to do so in advance on the Data tab.
