- Home
- :
- All Communities
- :
- Developers
- :
- JavaScript Maps SDK
- :
- JavaScript Maps SDK Questions
- :
- GetCentroid of selected feature layer, scale-depen...
- Subscribe to RSS Feed
- Mark Topic as New
- Mark Topic as Read
- Float this Topic for Current User
- Bookmark
- Subscribe
- Mute
- Printer Friendly Page
GetCentroid of selected feature layer, scale-dependent issue, Javascript API
- Mark as New
- Bookmark
- Subscribe
- Mute
- Subscribe to RSS Feed
- Permalink
- Report Inappropriate Content
I've written some code based on this ESRI sample: Feature Layer with Selection
My goal is to have the user select property boundaries (parcels) on the map, use the selected features to get the centroid of each property, and then send those centroids through to the Directions widget.
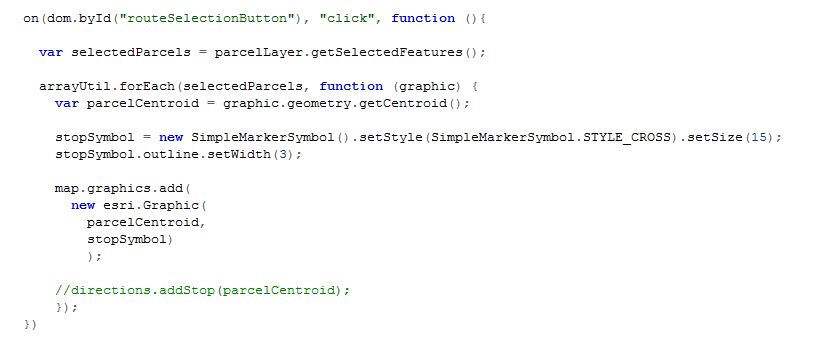
Here's the function that runs after the user has already selected their property boundaries (wired to a button click):
And here's the issue...depending on my zoom-level at the time of selection, I get vastly different results.
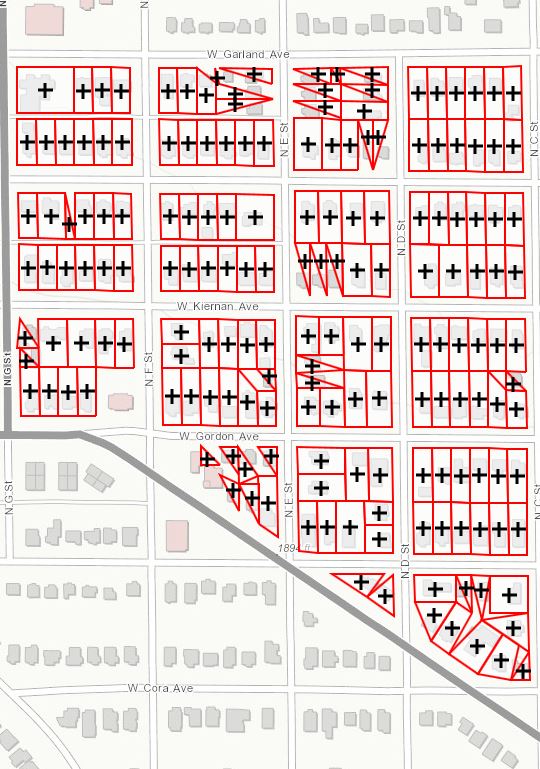
When selecting parcels while zoomed-out, centroids look correct, but selection graphics become triangles:
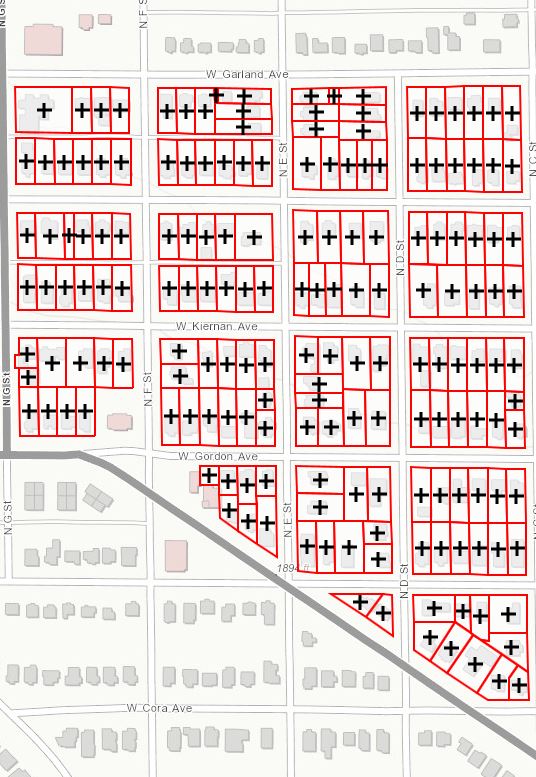
Mid-zoom selection produces these results, which appear correctly:
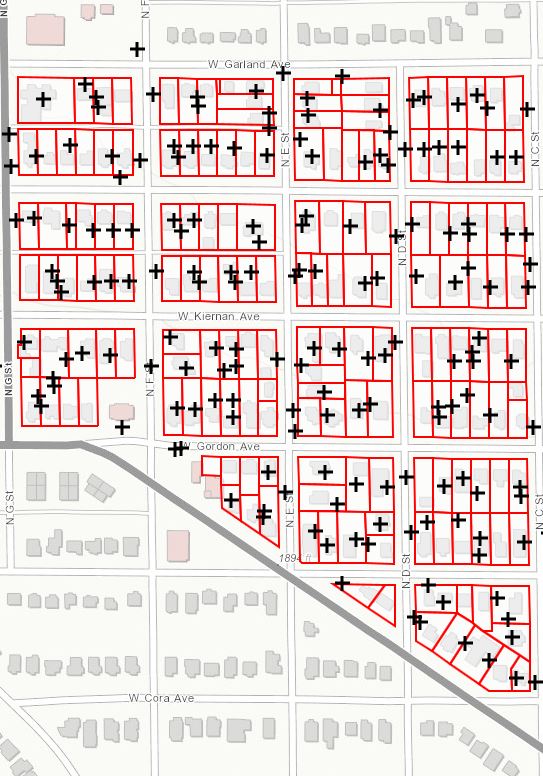
When selecting while zoomed-in closely, I get wildly inaccurate centroids.
It's obvious that I have something wrong, but I'm not sure what... I'm new at JavaScript, so I'm guessing that I haven't accounted for something in the way the graphics work.
Any help would be much appreciated!
Message was edited by: Shawna Ernst Added attachment with the full code (service names removed).
- Mark as New
- Bookmark
- Subscribe
- Mute
- Subscribe to RSS Feed
- Permalink
- Report Inappropriate Content
Shawna,
WOW, I have not seen such displacement errors before. Can you share all of your code for review?
- Mark as New
- Bookmark
- Subscribe
- Mute
- Subscribe to RSS Feed
- Permalink
- Report Inappropriate Content
Sure, Robert. I appreciate you taking a look. I just attached it to my original post.
- Mark as New
- Bookmark
- Subscribe
- Mute
- Subscribe to RSS Feed
- Permalink
- Report Inappropriate Content
Shawna,
I don't seem to have these issues when I swap out your URL for mine and use your exact code. Seems like you may be having map service issues.
- Mark as New
- Bookmark
- Subscribe
- Mute
- Subscribe to RSS Feed
- Permalink
- Report Inappropriate Content
Interesting. Okay- I will play around with my map service.
It's running on 10.3 and set to Web Mercator to match the ESRI basemap.
- Mark as New
- Bookmark
- Subscribe
- Mute
- Subscribe to RSS Feed
- Permalink
- Report Inappropriate Content
I've tried this with a 10.3 service, 10.0 service, and an AGOL-hosted feature layer - and I get the exact same issue with all my tests.
I've also tried updating the maxAllowableOffset parameter in Javascript, updating the "Max number of records returned by the server" parameter on the map service, and using a completely different dataset - all tests produced the same result.
I think I may open a support case.
- Mark as New
- Bookmark
- Subscribe
- Mute
- Subscribe to RSS Feed
- Permalink
- Report Inappropriate Content
Shawna,
Yes my recommendation would be to call tech support.
- Mark as New
- Bookmark
- Subscribe
- Mute
- Subscribe to RSS Feed
- Permalink
- Report Inappropriate Content
What happens when you specify "autoGeneralize: false" when constructing the parcel featureLayer?..
- Mark as New
- Bookmark
- Subscribe
- Mute
- Subscribe to RSS Feed
- Permalink
- Report Inappropriate Content
Steve, that makes it so my third picture (the zoomed-in selection), is what I get every single time. So, I never get the centroids within the parcels, but it does help with the weird triangles from the first (zoomed-out) picture.
- Mark as New
- Bookmark
- Subscribe
- Mute
- Subscribe to RSS Feed
- Permalink
- Report Inappropriate Content
For everyone following this...I submitted a support ticket to ESRI and they came back with the suggestion that I change
var parcelCentroid = graphic.geometry.getCentroid()
to:
var parcelCentroid = graphic.geometry.getExtent().getCenter();
They gave the following reason: "The geometries can be complex at times, may be self intersecting and essentially depends on the pointcollection and rings used to create the polygon. So generally the approach is to generalize or simplify the geometry. You could use the above line instead of getcentroid() method. I have tested it on my end and is working for me."
I didn't go with this approach initially because I was concerned that the center of the extent won't always be located within the polygon boundary.
I may end up creating parcel points and just selecting those. I'd prefer to do it in code, but I want to make sure what I've got is accurate.