- Home
- :
- All Communities
- :
- Developers
- :
- JavaScript Maps SDK
- :
- JavaScript Maps SDK Questions
- :
- Measurement widget location
- Subscribe to RSS Feed
- Mark Topic as New
- Mark Topic as Read
- Float this Topic for Current User
- Bookmark
- Subscribe
- Mute
- Printer Friendly Page
- Mark as New
- Bookmark
- Subscribe
- Mute
- Subscribe to RSS Feed
- Permalink
- Report Inappropriate Content
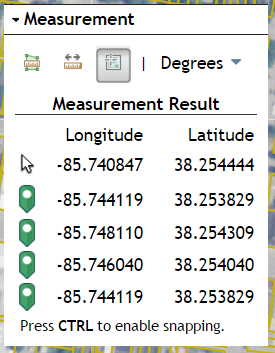
I am trying to change the location behavior within the measure widget. my goal is to continue appending the locations each time the user clicks on the map and also not clearing the location graphics on the map. These locations will be then sent in an email. I could create a different container to perform this task but I thought since I already have the measurement widget I may just use it.
   var measurement = new Measurement({
        map: map
    }, dom.byId("measurementDiv"));
    measurement.startup();


    measurement.on("measure-end", getmeasure);
    function getmeasure(evt) {
        //console.log(evt);
        switch (evt.toolName) {
            case "location":
                console.log("Lat: " + evt.values[0] + " Lng: " + evt.values[1]);
                var tbl = $(".esriMeasurementResultTable tbody");
                tbl.append("<tr>"+
                    "<td><img src='images/esriGreenPin16x26.png' style='vertical-align:middle'></td>" +
                    "<td class='esriMeasurementTableCell'>" + evt.values[0] + "</td><td class='esriMeasurementTableCell'>" + evt.values[1] + "</td>");
                break;
            default:


                break;
        }


    }
Is there a different way of doing this?
Solved! Go to Solution.
Accepted Solutions
- Mark as New
- Bookmark
- Subscribe
- Mute
- Subscribe to RSS Feed
- Permalink
- Report Inappropriate Content
Richard,
Here is a sample. I am not a JQuery fan when you already have the dojo library that can do all you are trying to do without loading another 3rd party library, so I removed references to JQuery from my sample.
<!DOCTYPE html>
<html>

<head>
  <meta http-equiv="Content-Type" content="text/html; charset=utf-8">
  <!--The viewport meta tag is used to improve the presentation and behavior of the samples
    on iOS devices-->
  <meta name="viewport" content="initial-scale=1, maximum-scale=1,user-scalable=no">
  <title>Measure Tool</title>
  <link rel="stylesheet" href="http://js.arcgis.com/3.14/dijit/themes/claro/claro.css">
  <link rel="stylesheet" href="http://js.arcgis.com/3.14/esri/css/esri.css">
  <style>
    html,
    body {
      height: 100%;
      width: 100%;
      margin: 0;
    }

    body {
      background-color: #FFF;
      overflow: hidden;
      font-family: "Trebuchet MS";
    }

    #map {
      border: solid 2px #808775;
      -moz-border-radius: 4px;
      -webkit-border-radius: 4px;
      border-radius: 4px;
      margin: 5px;
      padding: 0px;
    }

    #titlePane {
      width: 240px;
    }

    .claro .dijitTitlePaneTitle {
      background: #fff;
      font-weight: 600;
      border: none;
      border-bottom: solid 1px #29201A;
      border-top: solid 1px #29201A;
    }

    .claro .dijitTitlePaneTitleHover {
      background: #eee;
    }

    .claro .dijitTitlePaneTitleActive {
      background: #808775;
    }

    .claro .dijitTitlePaneContentOuter {
      border-right: none;
      border-bottom: none;
      border-left: none;
    }
  </style>
  <script src="http://js.arcgis.com/3.14/"></script>
  <script>
    var map;
    require([
        "dojo/dom",
        "esri/Color",
        "dojo/keys",
        "dojo/parser",
        "dojo/query",
        "dojo/on",
        "dojo/dom-construct",
        "dojo/_base/array",
        "dojo/dom-style",

        "esri/config",
        "esri/sniff",
        "esri/map",
        "esri/SnappingManager",
        "esri/dijit/Measurement",
        "esri/layers/FeatureLayer",
        "esri/layers/GraphicsLayer",
        "esri/graphic",
        "esri/renderers/SimpleRenderer",
        "esri/tasks/GeometryService",
        "esri/symbols/SimpleLineSymbol",
        "esri/symbols/SimpleFillSymbol",
        "esri/symbols/PictureMarkerSymbol",

        "esri/dijit/Scalebar",
        "dijit/layout/BorderContainer",
        "dijit/layout/ContentPane",
        "dijit/TitlePane",
        "dijit/form/CheckBox",
        "dojo/domReady!"
      ], function (
      dom, Color, keys, parser, query, on, domConstruct, array, domStyle,
      esriConfig, has, Map, SnappingManager, Measurement, FeatureLayer, GraphicsLayer, Graphic,
      SimpleRenderer, GeometryService, SimpleLineSymbol, SimpleFillSymbol, PictureMarkerSymbol
    ) {
      parser.parse();
      //This sample may require a proxy page to handle communications with the ArcGIS Server services. You will need to
      //replace the url below with the location of a proxy on your machine. See the 'Using the proxy page' help topic
      //for details on setting up a proxy page.
      esriConfig.defaults.io.proxyUrl = "/proxy/";
      esriConfig.defaults.io.alwaysUseProxy = false;

      //This service is for development and testing purposes only. We recommend that you create your own geometry service for use within your applications
      esriConfig.defaults.geometryService = new GeometryService("http://tasks.arcgisonline.com/ArcGIS/rest/services/Geometry/GeometryServer");

      map = new Map("map", {
        basemap: "satellite",
        center: [-85.743, 38.256],
        zoom: 17
      });

      var sfs = new SimpleFillSymbol(
        "solid",
        new SimpleLineSymbol("solid", new Color([195, 176, 23]), 2),
        null
      );

      var parcelsLayer = new FeatureLayer("http://sampleserver1.arcgisonline.com/ArcGIS/rest/services/Louisville/LOJIC_LandRecords_Louisville/M...", {
        mode: FeatureLayer.MODE_ONDEMAND,
        outFields: ["*"]
      });
      parcelsLayer.setRenderer(new SimpleRenderer(sfs));
      map.addLayers([parcelsLayer]);

      //dojo.keys.copyKey maps to CTRL on windows and Cmd on Mac., but has wrong code for Chrome on Mac
      var snapManager = map.enableSnapping({
        snapKey: has("mac") ? keys.META : keys.CTRL
      });
      var layerInfos = [{
        layer: parcelsLayer
        }];
      snapManager.setLayerInfos(layerInfos);

      var measureGL = new GraphicsLayer();
      var pms = new PictureMarkerSymbol('http://js.arcgis.com/3.14/esri/dijit/images/esriGreenPin16x26.png', 16, 26);
      pms.setOffset(0, 12);
      map.addLayers([measureGL]);

      var measurement = new Measurement({
        map: map,
      }, dom.byId("measurementDiv"));
      measurement.startup();

      measurement.on("tool-change", function (evt) {
        if (evt.toolName !== "location") {
          //If a tool other than the location tool or the location tool has been toggled off
          //Clear the graphics layer
          measureGL.clear();
          //Remove all the rows of locations added by the code
          var rows = query(".myMeasurementTableRow");
          array.forEach(rows, function (row) {
            domConstruct.destroy(row);
          });
          //Hide the Graphics Layer
          measureGL.hide();
        } else {
          //Hide the Graphics Layer
          measureGL.show();
          //show the standard location measure row that was hidden
          var mRows = query(".esriMeasurementTableRow");
          domStyle.set(mRows[1], "display", "");
        }
      });

      measurement.on("measure-end", function (evt) {
        switch (evt.toolName) {
        case "location":
          //console.log("Lat: " + evt.values[0] + " Lng: " + evt.values[1]);
          var tbl = query(".esriMeasurementResultTable tbody")[0];
          var mRows = query(".esriMeasurementTableRow");
          var row = domConstruct.toDom("<tr class='myMeasurementTableRow'>" +
            "<td><img src='http://js.arcgis.com/3.14/esri/dijit/images/esriGreenPin16x26.png' style='vertical-align:middle'></td>" +
            "<td class='esriMeasurementTableCell'>" + evt.values[0] + "</td><td class='esriMeasurementTableCell'>" + evt.values[1] + "</td></tr>");
          //Hide the standard measure loaction row so that there is not two identical measures
          domStyle.set(mRows[1], "display", "none");
          domConstruct.place(row, tbl);
          //Add the measure to the Graphics Layer
          measureGL.add(new Graphic(evt.geometry, pms, {
            "Lat": evt.values[0],
            "Lon": evt.values[1]
          }))
          break;
        default:
          break;
        }
      });
    });
  </script>
</head>

<body class="claro">
  <div id="mainWindow" data-dojo-type="dijit/layout/BorderContainer" data-dojo-props="design:'headline',gutters:false" style="width:100%; height:100%;">
    <div id="map" data-dojo-type="dijit/layout/ContentPane" data-dojo-props="region:'center'">
      <div style="position:absolute; right:20px; top:10px; z-Index:999;">
        <div id="titlePane" data-dojo-type="dijit/TitlePane" data-dojo-props="title:'Measurement', closable:'false', open:'false'">
          <div id="measurementDiv"></div>
          <span style="font-size:smaller;padding:5px 5px;">Press <b>CTRL</b> to enable snapping.</span>
        </div>
      </div>
    </div>
  </div>
</body>

</html>
- Mark as New
- Bookmark
- Subscribe
- Mute
- Subscribe to RSS Feed
- Permalink
- Report Inappropriate Content
Richard,
What part is not working for you?
- Mark as New
- Bookmark
- Subscribe
- Mute
- Subscribe to RSS Feed
- Permalink
- Report Inappropriate Content
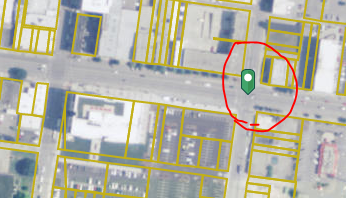
It is clearing out the previous marker from the map each time I click on the a new location. How to prevent the location from removing the previous marker?
- Mark as New
- Bookmark
- Subscribe
- Mute
- Subscribe to RSS Feed
- Permalink
- Report Inappropriate Content
Richard,
I am not sure how to prevent the Measure Widget from clearing the graphic before it creates a new one, so what I would do is create a new GraphicsLayer when you create the Measurement widget and then in your code for measure-end event add a graphic to the GL for each click. I would add a listener for the tool-change event so that you can clear the GL. Let me know if you need more specifics.
- Mark as New
- Bookmark
- Subscribe
- Mute
- Subscribe to RSS Feed
- Permalink
- Report Inappropriate Content
Yes I would need some specifics please.
Thank you Robert
- Mark as New
- Bookmark
- Subscribe
- Mute
- Subscribe to RSS Feed
- Permalink
- Report Inappropriate Content
Richard,
Here is a sample. I am not a JQuery fan when you already have the dojo library that can do all you are trying to do without loading another 3rd party library, so I removed references to JQuery from my sample.
<!DOCTYPE html>
<html>

<head>
  <meta http-equiv="Content-Type" content="text/html; charset=utf-8">
  <!--The viewport meta tag is used to improve the presentation and behavior of the samples
    on iOS devices-->
  <meta name="viewport" content="initial-scale=1, maximum-scale=1,user-scalable=no">
  <title>Measure Tool</title>
  <link rel="stylesheet" href="http://js.arcgis.com/3.14/dijit/themes/claro/claro.css">
  <link rel="stylesheet" href="http://js.arcgis.com/3.14/esri/css/esri.css">
  <style>
    html,
    body {
      height: 100%;
      width: 100%;
      margin: 0;
    }

    body {
      background-color: #FFF;
      overflow: hidden;
      font-family: "Trebuchet MS";
    }

    #map {
      border: solid 2px #808775;
      -moz-border-radius: 4px;
      -webkit-border-radius: 4px;
      border-radius: 4px;
      margin: 5px;
      padding: 0px;
    }

    #titlePane {
      width: 240px;
    }

    .claro .dijitTitlePaneTitle {
      background: #fff;
      font-weight: 600;
      border: none;
      border-bottom: solid 1px #29201A;
      border-top: solid 1px #29201A;
    }

    .claro .dijitTitlePaneTitleHover {
      background: #eee;
    }

    .claro .dijitTitlePaneTitleActive {
      background: #808775;
    }

    .claro .dijitTitlePaneContentOuter {
      border-right: none;
      border-bottom: none;
      border-left: none;
    }
  </style>
  <script src="http://js.arcgis.com/3.14/"></script>
  <script>
    var map;
    require([
        "dojo/dom",
        "esri/Color",
        "dojo/keys",
        "dojo/parser",
        "dojo/query",
        "dojo/on",
        "dojo/dom-construct",
        "dojo/_base/array",
        "dojo/dom-style",

        "esri/config",
        "esri/sniff",
        "esri/map",
        "esri/SnappingManager",
        "esri/dijit/Measurement",
        "esri/layers/FeatureLayer",
        "esri/layers/GraphicsLayer",
        "esri/graphic",
        "esri/renderers/SimpleRenderer",
        "esri/tasks/GeometryService",
        "esri/symbols/SimpleLineSymbol",
        "esri/symbols/SimpleFillSymbol",
        "esri/symbols/PictureMarkerSymbol",

        "esri/dijit/Scalebar",
        "dijit/layout/BorderContainer",
        "dijit/layout/ContentPane",
        "dijit/TitlePane",
        "dijit/form/CheckBox",
        "dojo/domReady!"
      ], function (
      dom, Color, keys, parser, query, on, domConstruct, array, domStyle,
      esriConfig, has, Map, SnappingManager, Measurement, FeatureLayer, GraphicsLayer, Graphic,
      SimpleRenderer, GeometryService, SimpleLineSymbol, SimpleFillSymbol, PictureMarkerSymbol
    ) {
      parser.parse();
      //This sample may require a proxy page to handle communications with the ArcGIS Server services. You will need to
      //replace the url below with the location of a proxy on your machine. See the 'Using the proxy page' help topic
      //for details on setting up a proxy page.
      esriConfig.defaults.io.proxyUrl = "/proxy/";
      esriConfig.defaults.io.alwaysUseProxy = false;

      //This service is for development and testing purposes only. We recommend that you create your own geometry service for use within your applications
      esriConfig.defaults.geometryService = new GeometryService("http://tasks.arcgisonline.com/ArcGIS/rest/services/Geometry/GeometryServer");

      map = new Map("map", {
        basemap: "satellite",
        center: [-85.743, 38.256],
        zoom: 17
      });

      var sfs = new SimpleFillSymbol(
        "solid",
        new SimpleLineSymbol("solid", new Color([195, 176, 23]), 2),
        null
      );

      var parcelsLayer = new FeatureLayer("http://sampleserver1.arcgisonline.com/ArcGIS/rest/services/Louisville/LOJIC_LandRecords_Louisville/M...", {
        mode: FeatureLayer.MODE_ONDEMAND,
        outFields: ["*"]
      });
      parcelsLayer.setRenderer(new SimpleRenderer(sfs));
      map.addLayers([parcelsLayer]);

      //dojo.keys.copyKey maps to CTRL on windows and Cmd on Mac., but has wrong code for Chrome on Mac
      var snapManager = map.enableSnapping({
        snapKey: has("mac") ? keys.META : keys.CTRL
      });
      var layerInfos = [{
        layer: parcelsLayer
        }];
      snapManager.setLayerInfos(layerInfos);

      var measureGL = new GraphicsLayer();
      var pms = new PictureMarkerSymbol('http://js.arcgis.com/3.14/esri/dijit/images/esriGreenPin16x26.png', 16, 26);
      pms.setOffset(0, 12);
      map.addLayers([measureGL]);

      var measurement = new Measurement({
        map: map,
      }, dom.byId("measurementDiv"));
      measurement.startup();

      measurement.on("tool-change", function (evt) {
        if (evt.toolName !== "location") {
          //If a tool other than the location tool or the location tool has been toggled off
          //Clear the graphics layer
          measureGL.clear();
          //Remove all the rows of locations added by the code
          var rows = query(".myMeasurementTableRow");
          array.forEach(rows, function (row) {
            domConstruct.destroy(row);
          });
          //Hide the Graphics Layer
          measureGL.hide();
        } else {
          //Hide the Graphics Layer
          measureGL.show();
          //show the standard location measure row that was hidden
          var mRows = query(".esriMeasurementTableRow");
          domStyle.set(mRows[1], "display", "");
        }
      });

      measurement.on("measure-end", function (evt) {
        switch (evt.toolName) {
        case "location":
          //console.log("Lat: " + evt.values[0] + " Lng: " + evt.values[1]);
          var tbl = query(".esriMeasurementResultTable tbody")[0];
          var mRows = query(".esriMeasurementTableRow");
          var row = domConstruct.toDom("<tr class='myMeasurementTableRow'>" +
            "<td><img src='http://js.arcgis.com/3.14/esri/dijit/images/esriGreenPin16x26.png' style='vertical-align:middle'></td>" +
            "<td class='esriMeasurementTableCell'>" + evt.values[0] + "</td><td class='esriMeasurementTableCell'>" + evt.values[1] + "</td></tr>");
          //Hide the standard measure loaction row so that there is not two identical measures
          domStyle.set(mRows[1], "display", "none");
          domConstruct.place(row, tbl);
          //Add the measure to the Graphics Layer
          measureGL.add(new Graphic(evt.geometry, pms, {
            "Lat": evt.values[0],
            "Lon": evt.values[1]
          }))
          break;
        default:
          break;
        }
      });
    });
  </script>
</head>

<body class="claro">
  <div id="mainWindow" data-dojo-type="dijit/layout/BorderContainer" data-dojo-props="design:'headline',gutters:false" style="width:100%; height:100%;">
    <div id="map" data-dojo-type="dijit/layout/ContentPane" data-dojo-props="region:'center'">
      <div style="position:absolute; right:20px; top:10px; z-Index:999;">
        <div id="titlePane" data-dojo-type="dijit/TitlePane" data-dojo-props="title:'Measurement', closable:'false', open:'false'">
          <div id="measurementDiv"></div>
          <span style="font-size:smaller;padding:5px 5px;">Press <b>CTRL</b> to enable snapping.</span>
        </div>
      </div>
    </div>
  </div>
</body>

</html>
- Mark as New
- Bookmark
- Subscribe
- Mute
- Subscribe to RSS Feed
- Permalink
- Report Inappropriate Content
Thank you Robert, this approach is better.