- Home
- :
- All Communities
- :
- Products
- :
- ArcGIS Monitor
- :
- ArcGIS Monitor Questions
- :
- Creating Gauges for Current CPU in Dashboard
- Subscribe to RSS Feed
- Mark Topic as New
- Mark Topic as Read
- Float this Topic for Current User
- Bookmark
- Subscribe
- Mute
- Printer Friendly Page
Creating Gauges for Current CPU in Dashboard
- Mark as New
- Bookmark
- Subscribe
- Mute
- Subscribe to RSS Feed
- Permalink
- Report Inappropriate Content
I have just started exploring the ArcGIS Monitor API and have my first collection of Windows Hosts. I am wanting to create a custom dashboard that shows the current CPU and Memory usage of all our ArcGIS Server and other hosts through gauges for CPU (not sure what I will use for Mem yet) with the name of the machine beside the gauges.
I have enabled the Feature Service URL on the collection and added the data to Portal from a the URL.
When I review the data I am seeing a few problems. The metric data is a history and I am not seeing a way in dashboard to grab the last value entered. There is also no way to tie back to the name of the windows host without potentially hardcoding based on Component Id.
Is what I would like to do impossible in Dashboard (without having to implement some extract of the data to a table using a script)?
Do I need to instead look at PowerBI and talking to the Postgres DB directrly (Sure wish this was SQL database - that is another discussion though)
- Mark as New
- Bookmark
- Subscribe
- Mute
- Subscribe to RSS Feed
- Permalink
- Report Inappropriate Content
H @KevinRathgeber1,
> ... shows the current CPU and Memory usage of all our ArcGIS Server and other hosts through gauges for CPU ... with the name of the machine beside the gauges.
I'm not clear on how you're trying to set-up the data visualization. Can you please elaborate or provide a graphic? Sorry if I am missing something obvious.
- Mark as New
- Bookmark
- Subscribe
- Mute
- Subscribe to RSS Feed
- Permalink
- Report Inappropriate Content
Hi @KevinRathgeber1,
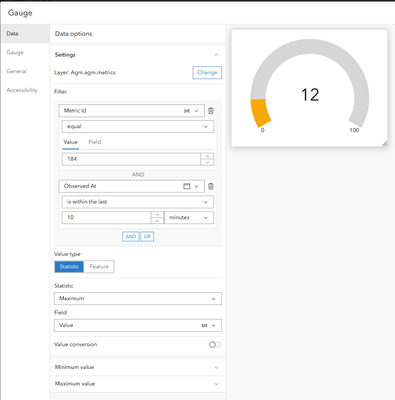
You are correct: there is no out-of-the-box way to grab the last recorded value of a specific metric for gauge elements. However, there are a few different ways of approaching this. The configuration pictured below will display the maximum value of a metric in the past 10 minutes:
Another option is to develop a data expression to extract information. See this community thread for more information.
Josh
- Mark as New
- Bookmark
- Subscribe
- Mute
- Subscribe to RSS Feed
- Permalink
- Report Inappropriate Content
I kind of like what you have indicated here, but that is the maximum value, not the most recent. Thinking this through I might be better to do an average over the last 5 or 10 minutes to kind of indicate the server has been doing because instant may not be a clear picture.
I was starting to contemplate adding some views to the database and using Power BI instead directly against the DB.
- Mark as New
- Bookmark
- Subscribe
- Mute
- Subscribe to RSS Feed
- Permalink
- Report Inappropriate Content
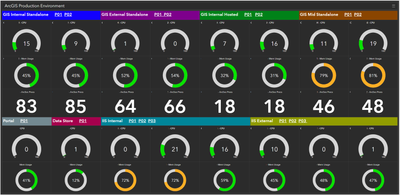
This is what I came up with so far. Thanks for the help
- Mark as New
- Bookmark
- Subscribe
- Mute
- Subscribe to RSS Feed
- Permalink
- Report Inappropriate Content
One item of note. I had to use Data Expressions or the data would not auto update.

