- Home
- :
- All Communities
- :
- Products
- :
- ArcGIS Online
- :
- ArcGIS Online Documents
- :
- Using FeatureSetBy functions in Arcade to drill-do...
- Subscribe to RSS Feed
- Mark as New
- Mark as Read
- Bookmark
- Subscribe
- Printer Friendly Page
- Report Inappropriate Content
Using FeatureSetBy functions in Arcade to drill-down to other layers and tables
Using FeatureSetBy functions in Arcade to drill-down to other layers and tables
Today a great blog was posted by Paul Barker on the new FeatureSet functions: What’s new with Arcade: Taking a stroll through FeatureSets (Part 1) and also Kelly Gerrow shared a great document on this topic: https://community.esri.com/community/gis/web-gis/arcgisonline/blog/2018/12/10/overlapping-features-i... .
I didn't wanted to be left behind, so I thought I would share some examples using hydrants, the maintenance history and sub sectors and hydraulic sectors to show what you can achieve with the new Arcade functions released in ArcGIS Online on December 5th
Consider we have a web map with several layers and a table:
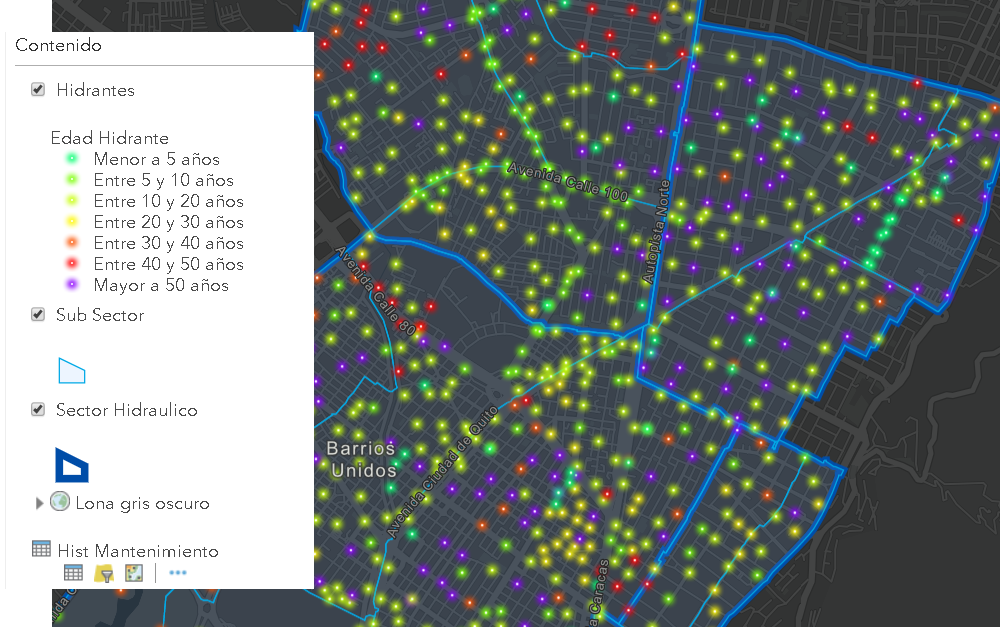
- Hidrantes is a point layer with hydrants
- Sub Sector is a polygon layer with a sub division of the area of interest
- Sector Hidraulico is a polygon layer merging sub sectors into hydraulic sectors
- Hist Mantenimiento is a table with the historic maintenance records for each hydrant
First of all, let’s apply some Arcade to visualize the hydrants based on their age. This was already possible in the previous release, so no new things here yet. We have the installation date stored in the field FECHAINSTALACION and we can use the DateDiff and Now functions to determine the age in years, which happens on the first two lines. After this we classify the value into significant ranges:
var fecha_inst = $feature.FECHAINSTALACION;
var edad = DateDiff(Now(), fecha_inst, "years");
var clase_edad = "";
if (edad > 50) {
clase_edad = "Mayor a 50 años";
} else if (edad > 40) {
clase_edad = "Entre 40 y 50 años";
} else if (edad > 30) {
clase_edad = "Entre 30 y 40 años";
} else if (edad > 20) {
clase_edad = "Entre 20 y 30 años";
} else if (edad > 10) {
clase_edad = "Entre 10 y 20 años";
} else if (edad > 5) {
clase_edad = "Entre 5 y 10 años";
} else {
clase_edad = "Menor a 5 años";
}
return clase_edad;
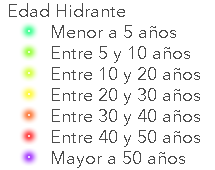
The result is a text describing the age, for which we can define representative symbols (here using the Firefly symbols):
No fancy symbols for the other two polygon layers to avoid distracting the attention from the hydrants.
We would like to show in the pop-up window of each hydrant the list of all maintenance carried out on the hydrant. Both the maintenance history table and the hydrant layer contain the ID of the hydrant. The table also contains the dates and type of maintenance.
In the configuration of the pop-up of the hydrants we can add an Arcade expression like this one:
var tbl = FeatureSetByName($datastore,"Hist_Mantenimiento");
var codigo = $feature["COD_HIDRANTE"];
var sql = "COD_HIDRANTE = '" + codigo + "'";
Console(sql);
var mantenimientos = Filter(tbl, sql);
var cnt = Count(mantenimientos);
var historia = "";
if (cnt > 0) {
historia = cnt + " Mantenimiento(s):";
for (var mantenimiento in mantenimientos) {
var txt_fecha = Text(mantenimiento.Fecha_Mantenimiento, ' - (Y/MM/DD) ');
var txt_man = txt_fecha + mantenimiento.Mantenimiento;
historia += TextFormatting.NewLine + txt_man;
}
} else {
historia = "No hay mantenimientos";
}
return historia;
First of all, we access the table with the maintenance history and assign it to a variable tbl. Then we read the id of the current hydrant for which we want to create the pop-up. We define a SQL expression using the hydrant ID which is then used to filter the history table. The result is stored in a variable called mantenimientos. We can do a Count to obtain the number of maintenance carried out on the hydrant. If the count (cnt) is larger than 0, we start reading out the details and construct a list of maintenance including the date and type of maintenance.
The result will appear like this after we configure a simple custom html to show the attributes and result of the Arcade expression in the pop-up:

Now let’s continue with doing something with these new Arcade functions to get some data hydrants at the sub sector level. Since the number of maintenance obviously depend on the age of the hydrant, it would be nice to get some details on this at the sub sector level.
In the pop-up configuration of the sub sectors we can add the following Arcade expression:
var fs = FeatureSetByName($datastore,"Hidrantes");
var hidrantes = Intersects(fs, $feature);
var cnt = Count(hidrantes);
var edad_tot = 0;
for (var hidrante in hidrantes) {
var edad = DateDiff(Now(), hidrante.FECHAINSTALACION, "years");
edad_tot += edad;
}
var resultado = "";
if (cnt > 0) {
var edad_media = edad_tot / cnt;
resultado = "Hay " + cnt + " hidrantes en el sub sector";
resultado += TextFormatting.NewLine + "La edad media de los hidrantes es de " + Round(edad_media, 2) + " años";
} else {
resultado = "No hay hidrantes en el sub sector";
}
return resultado;
This expression will:
- Access the Hydrants layer
- Do an intersect with the current sub sector feature
- Count the number of hydrants in the sub sector
- Calculate the age for each hydrant and some all ages
- Calculate the mean age of the hydrants and format the text with this information
The result will appear like this:
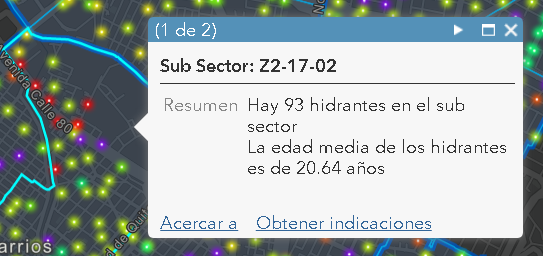
In this case there are 93 hydrants in the sub sector and the mean age is 20.64 years.
This is fun, but can we also show the names of the sub sectors that are contained by a hydraulic sector using these new Arcade functions? The answer is yes. Let’s add the following expression to the hydraulic sectors:
var fs = FeatureSetByName($datastore,"Sub Sector");
var subsectores = Intersects(fs, $feature);
var cnt = Count(subsectores);
var resultado = "Listado de los " + cnt + " Subsectores:";
for (var subsector in subsectores) {
resultado += TextFormatting.NewLine + subsector.IDSAP;
}
return resultado;
Just access the sub sectors layer and Intersect with the current hydraulic sector and voila…, rights? No, not so right. When you use an Intersect between two polygon layers, it will probably return too many features due to the fact that when two polygons have a matching boundary they will probably be included in the result, leading to more sub sectors than we want.
A way to avoid this is to use a small negative buffer on the hydraulic sector and do the Intersect with that buffered geometry like this:
var fs = FeatureSetByName($datastore,"Sub Sector");
var feature_buf = Buffer($feature, -100, 'meters');
var subsectores = Intersects(fs, feature_buf);
var cnt = Count(subsectores);
var resultado = "Listado de los " + cnt + " Subsectores:";
for (var subsector in subsectores) {
resultado += TextFormatting.NewLine + subsector.IDSAP;
}
return resultado;
Notice the Buffer with a negative distance that is created on line 2 and used on line 3 to get the rights polygons.
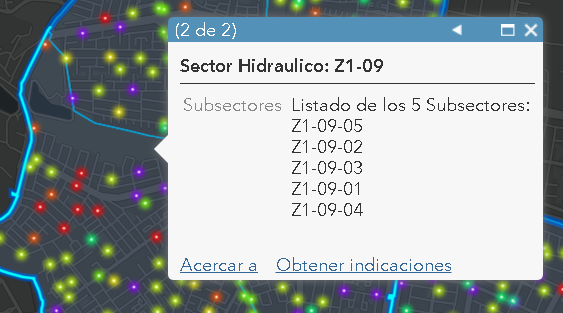
The resulting pop-up will show like this:
To be honest, I don’t like the unsorted list of sub sectors, so let’s order this list using OrderBy:
var fs = FeatureSetByName($datastore,"Sub Sector");
var feature_buf = Buffer($feature, -100, 'meters');
var subsectores = OrderBy(Intersects(fs, feature_buf), 'IDSAP ASC');
var cnt = Count(subsectores);
var resultado = "Listado de los " + cnt + " Subsectores:";
for (var subsector in subsectores) {
resultado += TextFormatting.NewLine + subsector.IDSAP;
}
return resultado;
Which will result in a sorted list of sub sectors:

I hope that these examples will help you to understand what is possible using Arcade with the latest update in ArcGIS Online, but before you jump in and start creating fabulous Arcade expressions I want to quote Uncle Ben (Spider-Man) for a moment:
With great power comes great responsibility...
As Paul Barker mentions in his blog, be careful and always validate that the performance of your expressions yield in an acceptable response time for your end-user.
- Mark as Read
- Mark as New
- Bookmark
- Permalink
- Report Inappropriate Content
Love this. Thank you Xander.
- Mark as Read
- Mark as New
- Bookmark
- Permalink
- Report Inappropriate Content
This is great! Assuming I'm adapting the script correctly (no errors were thrown), I cannot get the result to show in the pop-up when adding the attribute expression. Is there a trick with the custom html you reference above to get this to display in the pop-up?
Thanks!
- Mark as Read
- Mark as New
- Bookmark
- Permalink
- Report Inappropriate Content
N, no tricks here... It should appear by default. Can you share the expression and a screenshot of the result when you test it in the Arcade window?
- Mark as Read
- Mark as New
- Bookmark
- Permalink
- Report Inappropriate Content
Thanks Xander! Here is the expression:
var tbl = FeatureSetById($datastore, /* Bridge_Observations */ "1");
var siteid = $feature["LOCATION_ID"];
var sql = "LOCATION_ID = '" + siteid + "'";
Console(sql);
var visits = Filter(tbl, sql);
var cnt = Count(visits);
var history = "";
if (cnt > 0) {
history = cnt + "Recent Observations:";
for (var visit in visits) {
var txt_date = Text(Bridge_Observations.DATE_TIME, ' - (Y/MM/DD) ');
history += TextFormatting.NewLine + txt_date;
}
} else {
history = "No Recent Observations";
}
return history;
"Bridge_Observations" is the table of inspections that is related to feature layer for which I am adding the expression. LOCATION_ID is the key field.

- Mark as Read
- Mark as New
- Bookmark
- Permalink
- Report Inappropriate Content
Hi Peter Dalrymple ,
I notice that the name of the layer is indicated as /* Bridge_Observations */ "1"
If I understand you correctly, this should be "Bridge_Observations" (including the quotes) .
You also have a Console statement to show the sql you constructed. This should show up in the Messages tab. Is there any message there?
You could also include a Console statement on the second line to see if it connects to the data:
Console(Count(tbl));For the data to connect the tbl the Bridge_Observations table shoud exist in the same service as the current layer. If it does not, it won't work. If the table resides in the same map, you could change the first line to:
var tbl = FeatureSetById($map, "Bridge_Observations");However, you should use the exact name as used for the table as it exists in the map (this could be different from the name the data contains in the datastore).
- Mark as Read
- Mark as New
- Bookmark
- Permalink
- Report Inappropriate Content
Thanks for the reply. This is what I get in the messages when I add the Console(Count(tbl)); line.

And without it...
The expression tests without error when using var tbl = FeatureSetByName($map,"Bridge_Observations"); or var tbl = FeatureSetById($datastore, /* Bridge_Observations */ "1");
but neither produces a result in the pop-up.
The Bridge_Observations (w/o quotes) does exist within the same service as the current layer. However, the map seems to strip the underscore from the table in the Content tab of my map.![]() vs.
vs. 
Not sure if that would cause the issue. When I write my expression with the space instead of the underscore, I get a parse error on line 12. I also tried renaming to BridgeObservations, but still no joy.
Here is the current expression:
var tbl = FeatureSetByName($map,"Bridge_Observations");
Console(Count(tbl));
var siteid = $feature["LOCATION_ID"];
var sql = "LOCATION_ID = '" + siteid + "'";
Console(sql);
var visits = Filter(tbl, sql);
var cnt = Count(visits);
var history = "";
if (cnt > 0) {
history = cnt + "Recent Observations:";
for (var visit in visits) {
var txt_date = Text(Bridge_Observations.DATE_TIME, ' - (Y/MM/DD) ');
history += TextFormatting.NewLine + txt_date;
}
} else {
history = "No Recent Observations";
}
return history;
Thanks again for your help!
- Mark as Read
- Mark as New
- Bookmark
- Permalink
- Report Inappropriate Content
Could you try this (and if it does not yield the correct result, could you post back the messages?):
var tbl = FeatureSetById($datastore, "Bridge_Observations");
Console("There are " + Count(tbl) + " records in tbl");
var siteid = $feature["LOCATION_ID"];
var sql = "LOCATION_ID = '" + siteid + "'";
Console("sql: " + sql);
var visits = Filter(tbl, sql);
var cnt = Count(visits);
Console("There are " + cnt + " records in visits");
var history = "";
if (cnt > 0) {
history = cnt + " Recent Observations:";
Console(history);
for (var visit in visits) {
var txt_date = Text(visit.DATE_TIME, ' - (Y/MM/DD)');
history += TextFormatting.NewLine + txt_date;
Console(history);
}
} else {
history = "No Recent Observations";
}
return history;- Mark as Read
- Mark as New
- Bookmark
- Permalink
- Report Inappropriate Content
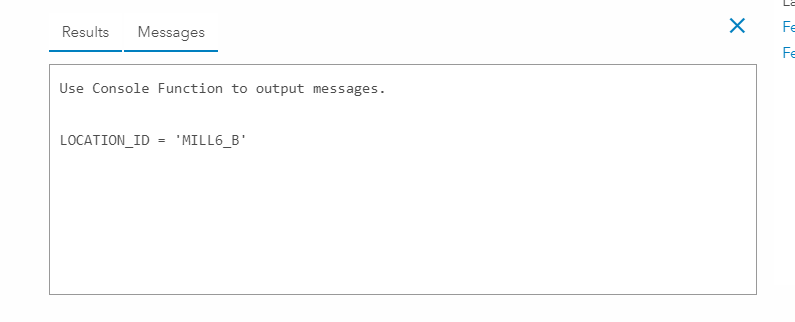
Unfortunately it didn't like it....
Results: Execution Error:Invalid Parameters for Count
Messages: Use Console Function to output messages.
Thanks!
- Mark as Read
- Mark as New
- Bookmark
- Permalink
- Report Inappropriate Content
This probably means that it couldn't have access to the data, for example that the table in the datastore is not exactly called "Bridge_Observations". You could use map$ in stead of datastore$, but then you have to use the exact name as the table is available in the map. Please provide some screenshots of the table name in the map and the table in the datastore.
- Mark as Read
- Mark as New
- Bookmark
- Permalink
- Report Inappropriate Content
Thanks Xander. Does this work?


- Mark as Read
- Mark as New
- Bookmark
- Permalink
- Report Inappropriate Content
Yes, that is perfect. Thanks. However, it doesn't explain why the Count of the FeatureSet returned should result in an error, since the names are exactly as you already described and used in the code. Would it be possible to share this content with me so that I can try some things to understand what is going on?
- Mark as Read
- Mark as New
- Bookmark
- Permalink
- Report Inappropriate Content
Absolutely. What is the best way to do that? I searched for you to invite to the group, but couldn't find you.
- Mark as Read
- Mark as New
- Bookmark
- Permalink
- Report Inappropriate Content
Can you try and add me using this account: "xbakker@esri.co_utility_esri_co"?
- Mark as Read
- Mark as New
- Bookmark
- Permalink
- Report Inappropriate Content
Done! Perishable Data Collection is what you're looking for. Thanks again!
- Mark as Read
- Mark as New
- Bookmark
- Permalink
- Report Inappropriate Content
Hi Peter Dalrymple ,
Thanks for sharing. It seems that there were a couple of errors in the expression. Have a look below:
// var tbl = FeatureSetByName($map,"Bridge Observations");
var tbl = FeatureSetByName($datastore,"Bridge_Observations");
Console(Count(tbl));
//for (var row in tbl) {
// Console("#" + row.LOCATION_ID +"#");
//}
var siteid = $feature["LOCATION_ID"];
Console(siteid);
var sql = "LOCATION_ID = '" + siteid + "'";
Console(sql);
var visits = Filter(tbl, sql);
var cnt = Count(visits);
Console("cnt=" + cnt);
var history = "";
if (cnt > 0) {
history = cnt + " Recent Observation(s):";
for (var visit in visits) {
var txt_date = Text(visit.DATE_TIME, ' - (Y/MM/DD) ');
history += TextFormatting.NewLine + txt_date;
Console(history);
}
} else {
history = "No Recent Observations";
}
return history;- I have included on line 1 (commented out) a way to access the bridges observations using the name used in the map$
- On line 2 the bridges observations is accessed through the datastore$ (use the navigations aids in the Arcade interface to get this exactly right)
- On lines 4 to 6 (commented out) I looped through the 5 observation records and wanted to know if there was a difference in writing that caused 0 observations to be found (this was not the case)
- On line 18 I changed your code. As you can see I am using "visit.DATE_TIME". visit is the variable created and represents each visit (record in the table) for this bridge. That is why you have to access the DATE_TIME attribute on this object.
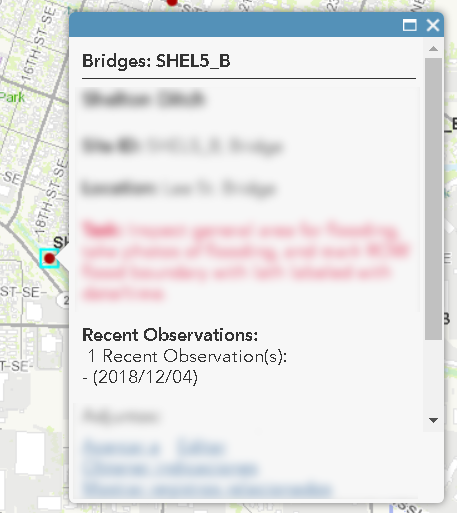
The result looks like this:
- Mark as Read
- Mark as New
- Bookmark
- Permalink
- Report Inappropriate Content
Thank's so much Xander! That makes perfect sense now. I very much appreciate your time and patience!
- Mark as Read
- Mark as New
- Bookmark
- Permalink
- Report Inappropriate Content
You're welcome! Glad it works and makes sense!
- Mark as Read
- Mark as New
- Bookmark
- Permalink
- Report Inappropriate Content
Hi Xander,
These examples have been very useful for summarizing spills information for districts. Thanks. One problem that I am having is trying to pull the most recent spill date when clicking on the districts. This is what I have so far:
var intersectLayer =Intersects(FeatureSetByName($map,"Spill Service Requests"), $feature)
for (var f in intersectLayer){
return Max(f.SR_Date_Time)
}
I get a result of NaN and Type 'Number'. How could I get the result in the correct format and bring back the date, and possibly other fields from that table. Any help is greatly appreciated. Thanks
- Mark as Read
- Mark as New
- Bookmark
- Permalink
- Report Inappropriate Content
Perhaps something like this could work:
var intersectLayer =Intersects(FeatureSetByName($map,"Spill Service Requests"), $feature);
var max_date = Date(1900, 0, 1);
for (var f in intersectLayer){
if (f.SR_Date_Time > max_date) {
max_date = f.SR_Date_Time;
}
}
return max_date;- Mark as Read
- Mark as New
- Bookmark
- Permalink
- Report Inappropriate Content
Thanks Xander. I did not get the expected date result until I filtered down to the most recent year or records, instead of many years of records. The first custom expression is from the full dataset, while the second custom expression was from the filtered layer, only from the last year.
Would it also be possible to list an attribute associated with the date, such as the ID or Address? Other than that, your help has been really helpful.

- Mark as Read
- Mark as New
- Bookmark
- Permalink
- Report Inappropriate Content
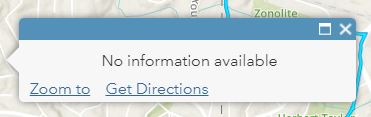
I also tried the other expression that you sent:
returnTop(OrderBy(Intersects(FeatureSetByName($map,"Spill Service Requests"),$feature),'SR_Date_Time DESC'),1); It works as great when I test the expression and I like how it brings back all of the other fields and attributes.However, the pop-up says no information.
- Mark as Read
- Mark as New
- Bookmark
- Permalink
- Report Inappropriate Content
Hi Collin Horace ,
Since I had no data to test the expression on, I wasn't aware of the fact that the entire record is returned, altough that makes perfect sense. So perhaps combining both questions you could do something like this:
var recent_record = Top(OrderBy(Intersects(FeatureSetByName($map,"Spill Service Requests"), $feature), 'SR_Date_Time DESC'), 1);
return recent_record.SR_Date_Time + TextFormatting.NewLine + recent_record.NameOfYourAddressField;
- Mark as Read
- Mark as New
- Bookmark
- Permalink
- Report Inappropriate Content
I got an error from that expression:

- Mark as Read
- Mark as New
- Bookmark
- Permalink
- Report Inappropriate Content
I think I know what is happening here. Although I only return the TOP 1, it might be a list of records with only one record.
Could you try this:
var recent_record = Top(OrderBy(Intersects(FeatureSetByName($map,"Spill Service Requests"), $feature), 'SR_Date_Time DESC'), 1)[0];
return recent_record.SR_Date_Time + TextFormatting.NewLine + recent_record.SR_;
- Mark as Read
- Mark as New
- Bookmark
- Permalink
- Report Inappropriate Content
Hi Xander,
This expression is ideal for a project I am currently working on to display historical inspections that's sat in a related table against our Hosted Feature Layer in AGOL. I am fairly new in using Arcade expressions so any help you can provide would be great. I am using the following expression based on what I've seen in this thread.
var tbl =FeatureSetByName($datastore,"Historical_Inspections");
Console(Count(tbl));
var gullyid = $feature["Central_Asset_ID"]
Console(gullyid);
var sql = "Central_Asset_ID = '" + gullyid + "'";
Console(sql);
var visits = Filter(tbl, sql);
var cnt = Count(visits);
Console("cnt=" + cnt);
var history = "";
if (cnt > 0) {
history = cnt + "Recent Inspection(s):";
for (var visit in visits) {
var txt_date = Text(visit.DATE_TIME, ' - (Y/MM/DD HH:MM) ');
history += TextFormatting.NewLine + txt_date;
Console(history);
}
} else {
history = "No Recent Inspections";
}
return history;
However, I keep receiving an the following error "Execution Error:Field not Found", despite it returning the correct number of records in the Message window seen below.
- Window Message.PNG)
When I then add the expression to the features pop-up it does display the 'No Recent Inspections' on assets which do not have any data sat in the related table, which is great.
- No Inspections.PNG)
But on the assets that should've have inspections such as the one below which has 2, the expression appears blank?
![]()
Any ideas on where I'm going wrong?
Sophie
- Mark as Read
- Mark as New
- Bookmark
- Permalink
- Report Inappropriate Content
Hi Sophie Humphry ,
As far as I can see from your code and the Console messages, all goes well until you probably hit line 14. The error message indicates that a field was not found. This could refer to visit.DATE_TIME in case you don't have a field with that exact name ("DATE_TIME"). It is also possible that the error occurs after line 14 for which I can't see what the code is. Please check the names of the fields to see if they match with the ones used in the code.
- Mark as Read
- Mark as New
- Bookmark
- Permalink
- Report Inappropriate Content
Hi Xander,
I hadn’t realised that was the field name, I’ve now replaced it with the field it should be looking at in my layer. However, I’m now receiving a different error message for this expression.
- Mark as Read
- Mark as New
- Bookmark
- Permalink
- Report Inappropriate Content
Can you share the error that you are receiving, and the entire Arcade expression and the schema of the data you are using?
- Mark as Read
- Mark as New
- Bookmark
- Permalink
- Report Inappropriate Content
I've fixed it! Realised I had removed 'visit' before putting in the correct date field and its now returning the inspection history for each of my assets.


Thank you for your help!!
- Mark as Read
- Mark as New
- Bookmark
- Permalink
- Report Inappropriate Content
Great, I'm glad you were able to resolve it!
- Mark as Read
- Mark as New
- Bookmark
- Permalink
- Report Inappropriate Content
I read through the troubleshooting messages between Peter Dalrymple and Xander Bakker thinking I had a similar issue connecting to a related table, but I've eliminated that as a possibility. I can connect and get a count of the records in the related table using either $datastore or $map, and I'm not getting the "Invalid Parameters for Count" like Peter did, just "Execution Error:Error".
It's a simple set up like the others' here, just trying to populate some info into a feature layer's popup from a related table (1:M cardinality). It's a sample locations point feature layer with results of multiple samples taken at each location in the related table (called "Exceedances_Only"). Using the Console() function, the problem seems to occur with counting the filtered from the related table:
Code:
var tbl = FeatureSetByName($map,"Exceedances_Only")
Console("There are " + Count(tbl) + " records in tbl")
var sample_loc = $feature["loc_id"];
var sql = "loc_id = '" + sample_loc + "'";
Console(sql);
var results = Filter(tbl, sql);
Console(results)
var cnt = Count(results);
Console(cnt)
Messages:
There are 467 records in tbl
loc_id = '17'
object, FeatureSet
Note that there's no output from the Console(cnt) function. If I comment out these last two lines I get no Execution Error, but I can't get any further:
var cnt = Count(results);
Console(cnt)
Thanks for any help. -NC
- Mark as Read
- Mark as New
- Bookmark
- Permalink
- Report Inappropriate Content
One problem solved, one problem remaining. Error above fixed by correctly entering the related field for the sample results table -- in the feature service it's "loc_id" but in the related table it's "loc_id_fk". So, changing that in the var sql line fixed that. I'm also connecting now to the "All Samples" table now instead of the "Exceedances Only" table. They are both identical except for "Exceedances Only" doesn't have related records for some sample locations, so it's easier to troubleshoot if I KNOW that there are related records for the first record in the table that the expression evaluates.
var tbl = FeatureSetByName($map,"All Samples")
var sample_loc = $feature["loc_id"];
var sql = "loc_id_fk = '" + sample_loc + "'";
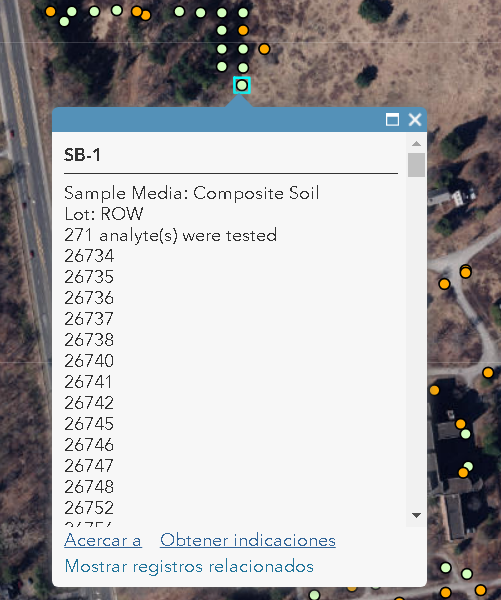
Running the entire expression now produces the correct result, which I've verified using the Test button in the expression builder window:

However, I'm not getting anything in the popup window. It seems that you just insert the expression name into the custom attribute display:

But I don't get the Result from the expression in the pop up window. Here's the full text of the expression:
var tbl = FeatureSetByName($map,"All Samples")
var sample_loc = $feature["loc_id"];
var sql = "loc_id_fk = '" + sample_loc + "'";
var results = Filter(tbl, sql);
var cnt = Count(results);
var results_list = "";
if (cnt > 0) {
results_list = cnt + " Result(s)";
for (var result in results) {
var txt_result_id = Text(result.result_id);
results_list += TextFormatting.NewLine + txt_result_id;
}
} else {
results_list = "No results";
}
return results_list;
Once I get this part working, the next challenge will be formatting other fields from the related table into an HTML table to appear in the popup. I'm assuming I can put all that into a single return variable (like results_list) in the for loop and it will spill into the custom attribute display... but first things first.
- Mark as Read
- Mark as New
- Bookmark
- Permalink
- Report Inappropriate Content
It is hard to test the code without access to the data. I made some minor changes to your code (missing ; ) but nothing that could explain this behavior:
var tbl = FeatureSetByName($map, "All Samples");
var sample_loc = $feature["loc_id"];
var sql = "loc_id_fk = '" + sample_loc + "'";
var results = Filter(tbl, sql);
var cnt = Count(results);
var results_list = "";
if (cnt > 0) {
results_list = cnt + " Result(s)";
for (var result in results) {
var txt_result_id = Text(result.result_id);
results_list += TextFormatting.NewLine + txt_result_id;
}
} else {
results_list = "No results";
}
return results_list;You will not be able to format the results in a HTML table. It will be plain text.
- Mark as Read
- Mark as New
- Bookmark
- Permalink
- Report Inappropriate Content
I sent you an invitation to the group where the web map and feature service are shared, but I don't think it gives you write-access. Nevertheless, it is now working. I changed nothing...
- Mark as Read
- Mark as New
- Bookmark
- Permalink
- Report Inappropriate Content
So weird. I'm experimenting with a second map now ("Demo" version in the group) with multiple expressions that simply list the number of records in each related table. The connection the "All Samples" table works and the returned value shows up in the pop-up window as it has since this morning. And now my second expression tests out OK in the expression builder but the returned value doesn't show up in the pop-up. Maybe this one will tomorrow morning after it's had a rest? 
- Mark as Read
- Mark as New
- Bookmark
- Permalink
- Report Inappropriate Content
Hi necurri , I haven't had the time to accept the invite and explore the content of the group and check your expression. I might not have write access to the content, but that does not matter. I hope to be able the check on what is configured later, but I'm pleased to hear that it is working now (although you changed nothing).
- Mark as Read
- Mark as New
- Bookmark
- Permalink
- Report Inappropriate Content
That is strange... I will look into that later (hopefully today)
- Mark as Read
- Mark as New
- Bookmark
- Permalink
- Report Inappropriate Content
Thanks. I was messing with it today but both maps are back to their semi-working state.
- Mark as Read
- Mark as New
- Bookmark
- Permalink
- Report Inappropriate Content
I just unquoted part of the code and it seems to be working just fine:
- Mark as Read
- Mark as New
- Bookmark
- Permalink
- Report Inappropriate Content
Hi Xander Bakker,
I too am having some difficulty displaying information from a related table. The table was generated using the "Generate Near Table" tool to show sites within 2 miles of facilities in the same layer (if any) and the distance in another field. My current expression looks like this:
var FacName = $feature.FID
var sql = "NEAR_FAC_NAME = '" + FacName + "'";
var NearFacsList = FeatureSetByName($map, 'LABRIC_Sites - LABRIC_Sites_Near_Table_20190416', ['NEAR_FAC_NAME', 'NEAR_FID'], false);
// Count(NearFacsList);
var assets = Filter(NearFacsList, sql);
var cnt = Count(NearFacsList);
var asset_info = "";
if (cnt > 0) {
// var asset_text = ""
for (var asset in assets) {
var asset_text = " - " + asset.name + TextFormatting.NewLine + asset.description;
asset_info = TextFormatting.NewLine + asset_text;
}
} else {
asset_info = "No Nearby Facilities";
}
return asset_info;
The result I am attempting to gain is a pop-up for each site that shows each of "child" sites within 2-miles. Additionally, I would implement a similar expression to pull the distance field in to show how far those nearby sites are.
Any advice or assistance in this matter would be greatly appreciated!
-H
- Mark as Read
- Mark as New
- Bookmark
- Permalink
- Report Inappropriate Content
Hey Xander,
This is very helpful stuff. Can the FeatureSetByName function also be used in ArcGIS Pro to get counts for intersecitng features stored in a gdb locally?
Thanks.
- Mark as Read
- Mark as New
- Bookmark
- Permalink
- Report Inappropriate Content
I assume that your problem starts at the first line of code. You are reading the FID which I assume is a feature ID (numeric) and not the name. This way you probably end up with 0 records in the resulting assets variable. It would be better to provide some screen shots of the data or provide access to the data to verify what is going wrong.
- Mark as Read
- Mark as New
- Bookmark
- Permalink
- Report Inappropriate Content
I think you should be able to do this in ArcGIS Pro. Just tested a small part (the FeatureSetByName, using the $map followed by a count) and that seems to work just fine.
- Mark as Read
- Mark as New
- Bookmark
- Permalink
- Report Inappropriate Content
Just did a little test and it does work in ArcGIS Pro:

Here you can see that there is no Sub sector field in my data:

... and here is the result when I identify a point:

- Mark as Read
- Mark as New
- Bookmark
- Permalink
- Report Inappropriate Content
Is your data stored in a geodatabase? Here is the error message I am getting: "ERROR 002717: Invalid Arcade expression, Arcade error: Object not found $map, Script line: 1"
- Mark as Read
- Mark as New
- Bookmark
- Permalink
- Report Inappropriate Content
My data is in a local File Geodatabase. Can you provide more details on where you are executing the Arcade expression and the details of the expression and data used?
- Mark as Read
- Mark as New
- Bookmark
- Permalink
- Report Inappropriate Content
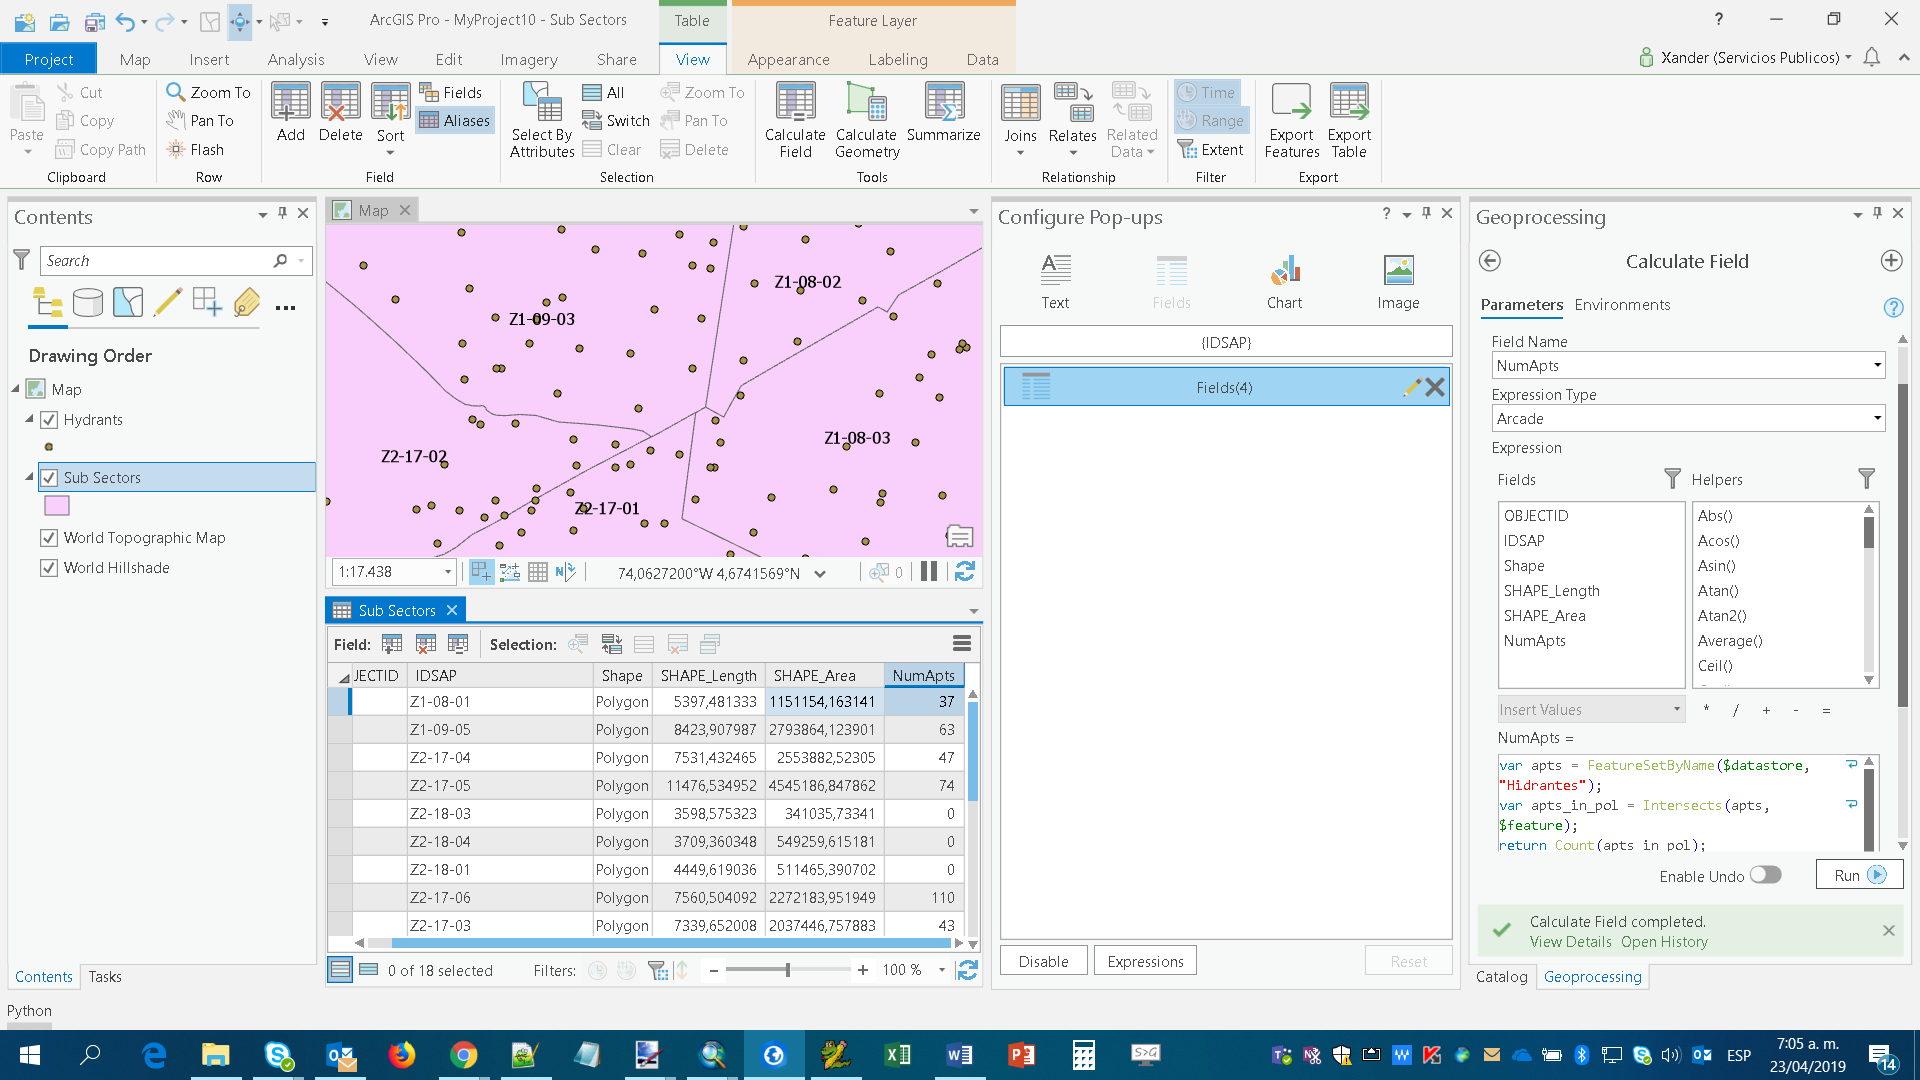
I am using the geoprocessing tool "calculate field" and I have one point feature layer and one polygon feature layer, both in the same file gdb. My expression is as follows:
var x = FeatureSetbyName($map,"Apartments");
var y = Count(Intersects(x, $feature));
return y
- Mark as Read
- Mark as New
- Bookmark
- Permalink
- Report Inappropriate Content
I see what you mean. It seems that the $map is something not available in the Field Calculation profile of ArcGIS Pro (it is available in ArcGIS Online). The $datastore is available. So if the apartments are stored in the same file geodatabase as the polygons it will work.
- Mark as Read
- Mark as New
- Bookmark
- Permalink
- Report Inappropriate Content
Great thanks! The $datastore did the the trick. I cannot tell you how useful it is to have the ability to summarize data for multiple features without having to do a spatial join. A real game changer.
- Mark as Read
- Mark as New
- Bookmark
- Permalink
- Report Inappropriate Content
Hi Xander Bakker
I've tried to borrow your code from above and combine a little bit of the comments you made on one of the others on here that required help, but I'm still getting no results (yet no error).
I am using a tree layer which has a globalid and
Tree_Assessment_Map - Assessments table which has a tree_id (matches globalid) and a Date field.
Is there any way that you can spot where I could have gone wrong?
var tbl = FeatureSetByName($map,"Tree_Assessment_Map - Assessments");
Console(Count(tbl));
for (var row in tbl) {
Console("#" + row.globalid + "#");
}
var code = $feature["globalid"];
var sql = "tree_id = '" + code + "'";
Console(sql);
var assessment = Filter(tbl, sql);
var cnt = Count(assessment);
var history = "";
if (cnt > 0) {
history = cnt + " Assessment(s):";
for (var assessment in assessments) {
var txt_date = Text(assessment.Date, ' - (DD/MM/Y) ' );
// var txt = txt_date + assessment.Assessment;
history += TextFormatting.NewLine + txt;
}
} else {
history = "No assessments";
}return history;