- Home
- :
- All Communities
- :
- Products
- :
- ArcGIS Pro
- :
- ArcGIS Pro Ideas
- :
- Symbology Quantities to show count
- Subscribe to RSS Feed
- Mark as New
- Mark as Read
- Bookmark
- Follow this Idea
- Printer Friendly Page
- Report Inappropriate Content
- Mark as New
- Bookmark
- Subscribe
- Mute
- Subscribe to RSS Feed
- Permalink
- Report Inappropriate Content
When symbolizing features using Quantities (Symbology tab), I would like to see a "COUNT" field next to RANGE and LABEL to show how many features fall into each range. And show this "count" in the legend in the TOC and map layout legend with a toggle to show/not show.
Also, if symbology values change, such as date values that change daily, the symbology would auto-update w/out having to go into the Layer Properties>Symbology dialog, click the Value field each time to update the layer.
- « Previous
-
- 1
- 2
- Next »
- Mark as Read
- Mark as New
- Bookmark
- Permalink
- Report Inappropriate Content
Add Feature Contents to a Legen: http://arcscripts.esri.com/details.asp?dbid=15069. It adds feature counts to each class' description in both class-breaks and unique-value renderers in ArcMap. Simply turn on the visibility of class descriptions in the legend to view these counts.
I haven't tried it out, so I don't know if it will work for Quanties, but it might be worth a shot.
I think this should be a core function. No matter how you symbolize, you should be able to see a count for each symbol, and if you can do that, then you should be able to toggle those counts on and off for the TOC/Legend.
- Mark as Read
- Mark as New
- Bookmark
- Permalink
- Report Inappropriate Content
Rich
- Mark as Read
- Mark as New
- Bookmark
- Permalink
- Report Inappropriate Content
Why this feature is not included in current versions?
http://edndoc.esri.com/arcobjects/9.2/CPP_VB6_VBA_VCPP_Doc/COM_Samples_Docs/Cartography/Renderers/aa...
- Mark as Read
- Mark as New
- Bookmark
- Permalink
- Report Inappropriate Content
This feature seems to exist in #arcdesktop 10.5, but not #arcpro 2.4
- Mark as Read
- Mark as New
- Bookmark
- Permalink
- Report Inappropriate Content
Michelle, are you referring to the count being shown in a legend or the Table of Contents of the map? Showing it in the legend is possible in both ArcMap and Pro. Showing it in the TOC/Contents Pane is not possible in either, and as far as I can tell would be the focus of this idea.
- Mark as Read
- Mark as New
- Bookmark
- Permalink
- Report Inappropriate Content
Right. Currently, the count of values of each class can be displayed in the legend. It would be great if the count of values (where applicable) of each class and their percent (%) can be displayed next to each class in the content pane without the need to calculate them

- Mark as Read
- Mark as New
- Bookmark
- Permalink
- Report Inappropriate Content
Hi Kory,
One of the capabilities that I keep going back to ArcMap for is seeing the counts in the symbology pane as seen in the picture below. I often use this as a guide to determine which classes I may want to merge or may not be represented in the dataset.
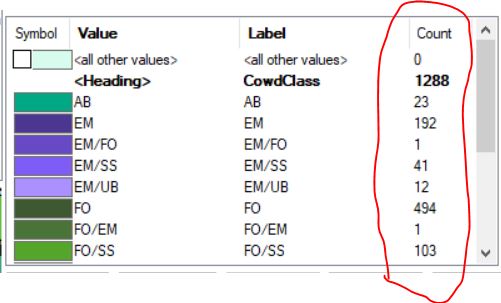
Is this available in ArcPro and I'm just unaware of where to look?
Thanks!
Michelle
- Mark as Read
- Mark as New
- Bookmark
- Permalink
- Report Inappropriate Content
Hi Michelle Totman
Did you see the Show Count option?


I think that should work for what you're describing.
Hope that helps!
- Mark as Read
- Mark as New
- Bookmark
- Permalink
- Report Inappropriate Content
Original poster should clarify that this is for the Table of Contents in a map, and not the layout (which I think we all know is possible). This could be done by the user right-clicking the label column header in the symbology window and selecting "Add count." The count column is already there. Why not use it?
I seem to remember doing an ArcObjects exercise back in the early oughts on doing this programmatically in VBA. The corresponding source for ArcPy has no mention of the class for the display of the symbology: https://pro.arcgis.com/en/pro-app/latest/arcpy/mapping/symbology-class.htm
- Mark as Read
- Mark as New
- Bookmark
- Permalink
- Report Inappropriate Content
Unique values symbology has this lovely little option for showing the count of items in each particular class:

It would be quite useful to have the same tool added to graduated colors and graduated circles symbology.

The histogram is sometimes okay for a quick eyeballing, but it would really be ideal to just see raw counts without a workaround.

You must be a registered user to add a comment. If you've already registered, sign in. Otherwise, register and sign in.