- Home
- :
- All Communities
- :
- Products
- :
- ArcGIS Pro
- :
- ArcGIS Pro Questions
- :
- Calculating average nearest neighbor distance (for...
- Subscribe to RSS Feed
- Mark Topic as New
- Mark Topic as Read
- Float this Topic for Current User
- Bookmark
- Subscribe
- Mute
- Printer Friendly Page
Calculating average nearest neighbor distance (for nth-order neighbors) for all points in a multi-point dataset
- Mark as New
- Bookmark
- Subscribe
- Mute
- Subscribe to RSS Feed
- Permalink
- Report Inappropriate Content
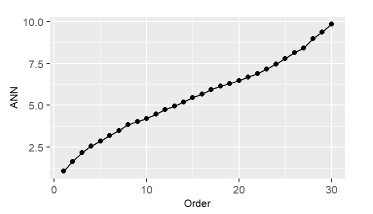
I have a multi-point dataset for which I'd like to prepare a plot with an average nearest neighbor value on y and the nth order of neighbors for which this value was calculated on x (e.g., 1st, 2nd, 3rd.... 20th order neighbors -see attached graphic for example). I have not found a tool in Pro that will do this calculation for me yet.
The Near tool calculates a Nearest Neighbor distance for each point, which is great, since this is the type of output I am looking for, but it doesn't seem to be able to do this for nth-order neighbors. The Calculate Distance Band For Neighbors tool will calculate an average nearest neighbor score for a custom nth order neighbor, but it will only give me one value, a summary statistic, for the whole dataset, not the nth average nearest neighbor value for each point.
Essentially, I'd like to end up with an output that looks like the made up table below, where each field is the distance to the nth order neighbor for each of the points in my dataset.
| OBJECTID | NearDist1 | NearDist2 | NearDist3 | NearDist4 |
| 1 | 7 | 13 | 39 | 50 |
| 2 | 3 | 4 | 12 | 16 |
| 3 | 10 | 18 | 55 | 89 |
Does anyone have ideas on how I might do this? I'd be grateful for any advice.
- Mark as New
- Bookmark
- Subscribe
- Mute
- Subscribe to RSS Feed
- Permalink
- Report Inappropriate Content
are you looking for
Average Nearest Neighbor (Spatial Statistics)—ArcGIS Pro | Documentation
How Average Nearest Neighbor works—ArcGIS Pro | Documentation
which requires the Spatial Statistics extensioin
... sort of retired...
- Mark as New
- Bookmark
- Subscribe
- Mute
- Subscribe to RSS Feed
- Permalink
- Report Inappropriate Content
Hi Dan,
Thanks for the suggestion, but Nearest Neighbor only calculates the average distance of the first nearest neighbor for a set of points.
I did, however, end up finding an awesome tool that does exactly what I was looking for. It's called Generate Near Table: https://pro.arcgis.com/en/pro-app/3.1/tool-reference/analysis/generate-near-table.htm
It does the same thing as Nearest Neighbor, but you can specify how many neighbors that you'd like to have distance calculated for from each point (e.g., give me the distance of each of the 10 nearest points, or 50 nearest points).
I've attached a map image called "100 nearest neighbors for two different points" that illustrates this.
Each of the orange points is the center of a potential open territory that an animal starting at one of the blue points could disperse to. The red lines connect this starting location to the boundaries of the 100 closest territories (represented by gray polygons).
The blue point labeled 4333 has many potential territories in a relatively small area. However, the animal that starts at point 6669 has to cover a larger area to find 100 potential territories. The generate near table calculates the distance from each of the orange points to it's 100 closest territories and ranks them 1-100 based on their proximity.
All kinds of fun analyses can be done with the new data table. My data set had ~45,000 points, so when I ran the tool it created a new point file with nearest neighbor distances for each point's 100 closest neighbors, I ended up with a table with ~45 million records. Amazingly, this tool only took about 2.5 minutes to run.
Hope this is helpful for anyone trying to do something similar. The output table has xy coordinates for both the FROM and TO points, which allows you to create the connector lines in this attached map using the xy to point tool.
- Mark as New
- Bookmark
- Subscribe
- Mute
- Subscribe to RSS Feed
- Permalink
- Report Inappropriate Content
Have you looked at the Generate Origin-Destination Links tool? I think it does exactly what you want as far as creating the spider diagram. It also calculates statistics unlike the Near Table tool.