- Home
- :
- All Communities
- :
- Products
- :
- ArcGIS Pro
- :
- ArcGIS Pro Questions
- :
- Problem with creating a Fishnet
- Subscribe to RSS Feed
- Mark Topic as New
- Mark Topic as Read
- Float this Topic for Current User
- Bookmark
- Subscribe
- Mute
- Printer Friendly Page
- Mark as New
- Bookmark
- Subscribe
- Mute
- Subscribe to RSS Feed
- Permalink
- Report Inappropriate Content
Hi,
I am having trouble with producing a fishnet for a sampling area that I want to produce sampling points/locations for.
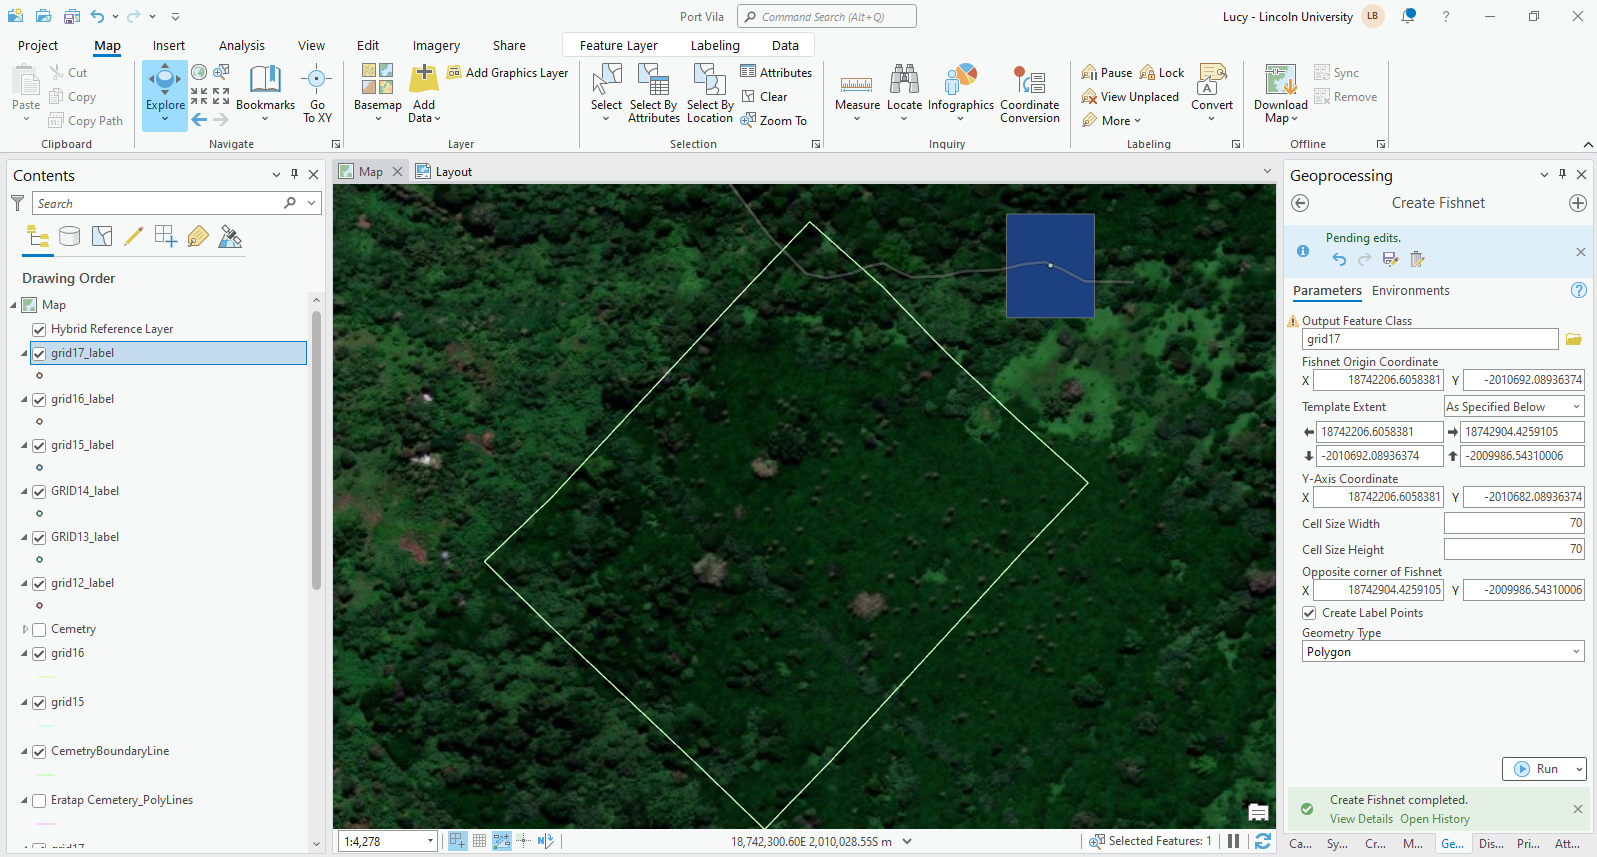
I have used a polygon (in NZTM coordinates) as the extent (polygon of the boundary of the sampling area). I have also set the cell size width and height at 70m and this is the distance I want between sampling locations.
This seems to make a box to the side of the boundary and no fishnet? Screenshot attached.
Any help would be appreciated. Thanks.
Solved! Go to Solution.
Accepted Solutions
- Mark as New
- Bookmark
- Subscribe
- Mute
- Subscribe to RSS Feed
- Permalink
- Report Inappropriate Content
Hi DanPatterson,
I made a copy of the shapefile to testEdit, added it to the map, added a field and calculated a value of the new field without saving the change. The tool warned about the pending edit but ran successfully because the tool doesn't use any feature information from the template feature class. I used 100 and 100 for cell width and height this time.

- Mark as New
- Bookmark
- Subscribe
- Mute
- Subscribe to RSS Feed
- Permalink
- Report Inappropriate Content
Are you expect negative Y values?
- Mark as New
- Bookmark
- Subscribe
- Mute
- Subscribe to RSS Feed
- Permalink
- Report Inappropriate Content
I am hoping for a grid to be generated within the boundary of the polygon
- Mark as New
- Bookmark
- Subscribe
- Mute
- Subscribe to RSS Feed
- Permalink
- Report Inappropriate Content
could you specify the parameters you used?
Create Fishnet (Data Management)—ArcGIS Pro | Documentation
How Create Fishnet works—ArcGIS Pro | Documentation
... sort of retired...
- Mark as New
- Bookmark
- Subscribe
- Mute
- Subscribe to RSS Feed
- Permalink
- Report Inappropriate Content
- Mark as New
- Bookmark
- Subscribe
- Mute
- Subscribe to RSS Feed
- Permalink
- Report Inappropriate Content
You have pending edits. Try finishing off the edit session and saving/discarding what you were working on first
... sort of retired...
- Mark as New
- Bookmark
- Subscribe
- Mute
- Subscribe to RSS Feed
- Permalink
- Report Inappropriate Content
Hi Lucy,
You said "This seems to make a box to the side of the boundary and no fishnet?"
Could you measure the dimension of the box? Is it 70m x 70m or approximately 700m x 700m which seems the template extent? Looking at the trees in the background imagery, it's more like 70m x 70m. I am not sure why it only created one cell of the expected 10x10(?) fishnet. You can share your data, if possible.
What version of ArcGIS Pro are you using?
- Mark as New
- Bookmark
- Subscribe
- Mute
- Subscribe to RSS Feed
- Permalink
- Report Inappropriate Content
- Mark as New
- Bookmark
- Subscribe
- Mute
- Subscribe to RSS Feed
- Permalink
- Report Inappropriate Content
Thanks for the data. It helped. Here is what I did:
1. Created a new project and added Port VilaBoundary.shp to the map.
2. Checked the layer's Properties and saw the projection and the Extent as shown below. Notice that all extent values are positive numbers. Which match the "N" (north) coordinates displayed at the bottom of the map (by the red arrow). I am not sure why the y coordinate at the bottom of your map shows "S".

3. I used "Browse..." option to browse to and select Port VilaBoundary.shp. The Template Extent values other necessary coordinate values were populated automatically. Specified 70 and 70 as the Cell Size Width and Height, and Polygon as the Geometry Type. The tool ran successfully and the fishnet was created as shown below.


Could you try the above and see if you get the same fishnet?
- Mark as New
- Bookmark
- Subscribe
- Mute
- Subscribe to RSS Feed
- Permalink
- Report Inappropriate Content
Dan, what happens if you run your workflow but don't have saved/pending edits?
... sort of retired...