- Home
- :
- All Communities
- :
- Products
- :
- ArcGIS Spatial Analyst
- :
- ArcGIS Spatial Analyst Questions
- :
- How to calculate skewness, kurtosis, quartiles wit...
- Subscribe to RSS Feed
- Mark Topic as New
- Mark Topic as Read
- Float this Topic for Current User
- Bookmark
- Subscribe
- Mute
- Printer Friendly Page
How to calculate skewness, kurtosis, quartiles with zonal statistics?
- Mark as New
- Bookmark
- Subscribe
- Mute
- Subscribe to RSS Feed
- Permalink
- Report Inappropriate Content
I would like to calculate more statistic parameters with the tool zonal statistics as table. I have to calculate the mean, median, stddev, variance, skewness, kurtosis and the quartiles for the elevation of some rasters and point-feature classes inside of some polygons. Hope someone can help me?
- Mark as New
- Bookmark
- Subscribe
- Mute
- Subscribe to RSS Feed
- Permalink
- Report Inappropriate Content
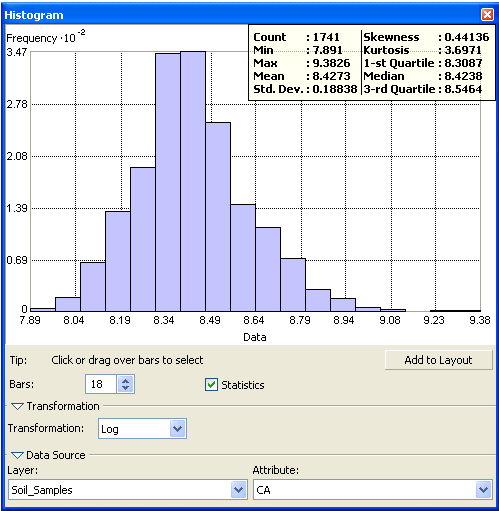
You could use Histograms—Help | ArcGIS Desktop (Also contains the option of Summary Statistics)
Think Location
- Mark as New
- Bookmark
- Subscribe
- Mute
- Subscribe to RSS Feed
- Permalink
- Report Inappropriate Content
Thank you, I tried that but i don't need the statistic for the whole raster, i need the statistic just for the areas inside the polygons. And I have over 1000 Polygons so it would be nice to have the data as a table
- Mark as New
- Bookmark
- Subscribe
- Mute
- Subscribe to RSS Feed
- Permalink
- Report Inappropriate Content
You have 2 of the necessary parameters to calculate kurtosis and skewness.
In their simplest form, the Kurtosis is the sum of each value ( x) from the mean ( u) to the 4th power ( x -u)^4, all divided by the variance squared (or standard deviation ^ 4th).. ( sum of ( (x-u)^4) / std dev ^4 ) (skewness (x-u^3, is similarly formed).
Getting the mean and std deviation or variance for each zone is no problem, however, you will still need to get the actual values for each cell in each zone in order to perform the top portion of the equation. This can be accomplished using numpy, but would require separating the values out on a zone basis. Similarly scipy has a kurtosis function but the requirement for single zones would help.
On the upside, you could get some sense of what is going on by getting measures for the other parameter. The sum, range, min, max, majority, minority, and variety etc. could be called into play if you really wanted to try and pull out an estimate of each.
So in short, converting the cells within a zone to points with their associated value could be used. I have some code on the Code Sharing site that does this