Turn on suggestions
Auto-suggest helps you quickly narrow down your search results by suggesting possible matches as you type.
Cancel
- Home
- :
- All Communities
- :
- Products
- :
- ArcGIS Web AppBuilder
- :
- ArcGIS Web AppBuilder Questions
- :
- Chart infographic not showing proper count
Options
- Subscribe to RSS Feed
- Mark Topic as New
- Mark Topic as Read
- Float this Topic for Current User
- Bookmark
- Subscribe
- Mute
- Printer Friendly Page
Chart infographic not showing proper count
Subscribe
304
0
10-03-2019 09:24 AM
10-03-2019
09:24 AM
- Mark as New
- Bookmark
- Subscribe
- Mute
- Subscribe to RSS Feed
- Permalink
- Report Inappropriate Content
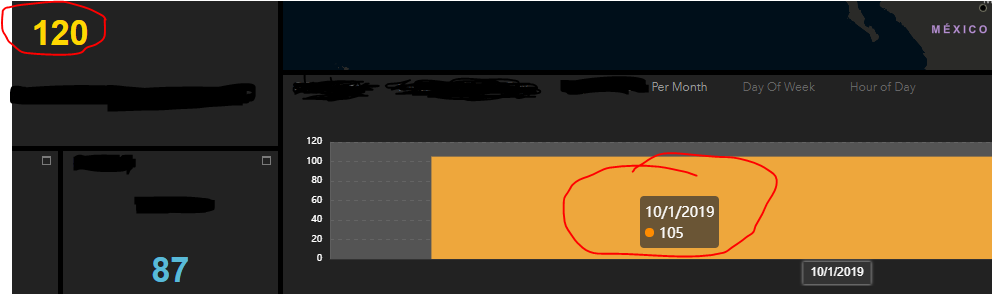
Web AppBuilder Dev Edition, v 2.13, Dashboard theme app.
I have two info graphics in my app. One that shows the count of all rows in the current feature set (the data source is an 'Extra Data Source' showing Stats for a layer. . And another that is supposed to show the count per month of the same Extra Data Source' in a bar chart. However if you look at the graphic below, the counter shows 120 (and the attribute table widget has 120 rows), The Chart Infographic widget that is set to group data by month (Minimum period = Month) is only showing a count of 105. Any explainations for how this happens and how to correct the issue would be appreciated as would any tips on how to troubleshoot.
0 Replies