- Home
- :
- All Communities
- :
- User Groups
- :
- Cartography and Maps
- :
- Questions
- :
- Re: Why do my raster cells seem to have a 'border'...
- Subscribe to RSS Feed
- Mark Topic as New
- Mark Topic as Read
- Float this Topic for Current User
- Bookmark
- Subscribe
- Mute
- Printer Friendly Page
Why do my raster cells seem to have a 'border'?
- Mark as New
- Bookmark
- Subscribe
- Mute
- Subscribe to RSS Feed
- Permalink
- Report Inappropriate Content
Hi
I'm at a bit of a loss here. I am attempting to generate a multi-directional hillshade, and the output raster cells seem to have a 'border' around them. I cannot for the life of me work out why and what to do about it.
What am I talking about? This:

The processing history behind this dataset:
1 - downloaded 1 second STRM elevation grid from USGS
2 - as SRTM is in an angular coordinate system, I resampled to a 20 x 20m grid (bilinear) - size not a neat match, but I thought it would be ok as the end use was hillshade rather than analysis
3 - as the STRM data is integer rather than floating, I ran Focal Statistics (average over 3x3 neighbourhood) to smooth
4 - down the multidirectional hillshade function, add to Image Analysis window, run the function on my smoothed data
The grid / borders only seem to appear on cells that have differing values in the cells adjacent to them.
Any ideas on what is causing this and how I can rectify or avoid it?
Many thanks
- Mark as New
- Bookmark
- Subscribe
- Mute
- Subscribe to RSS Feed
- Permalink
- Report Inappropriate Content
If you are worried about aesthetics, use cubic
This produces the smoothest image but can create values outside of the range found in the source data. It is suitable for continuous data.
You have already fudged the data to begin with so this may be what is needed for the 'viewing' at least.
- Mark as New
- Bookmark
- Subscribe
- Mute
- Subscribe to RSS Feed
- Permalink
- Report Inappropriate Content
What happens if you don't resample the DEM. Just reproject it to an appropriate Projected Coordinate System, if necessary. Keep the default cell size. And run the Hillshade function on it. This will ensure no/less loss of the raster values, thus the Hillshade values would be more accurate.
Think Location
- Mark as New
- Bookmark
- Subscribe
- Mute
- Subscribe to RSS Feed
- Permalink
- Report Inappropriate Content
Thanks Dan, Jayanta
It's strange behavior - the screenshot I posted above is down to the individual cell level, so the 'borders' as shown are a display issue as opposed to a data issue.
After some more tooling around, I've found it's related to the symbology options for the raster:
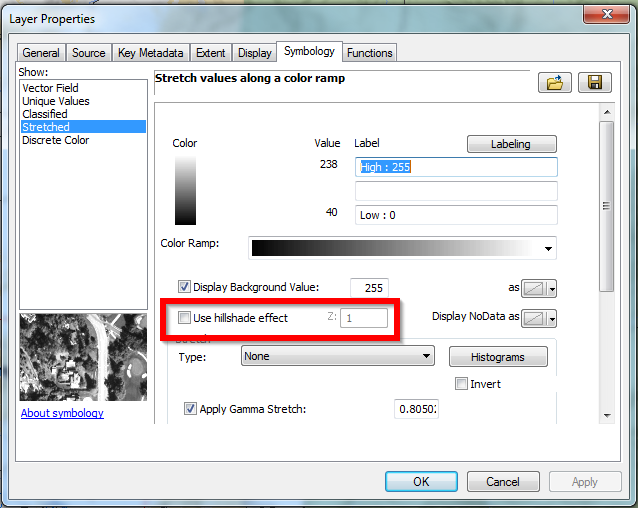
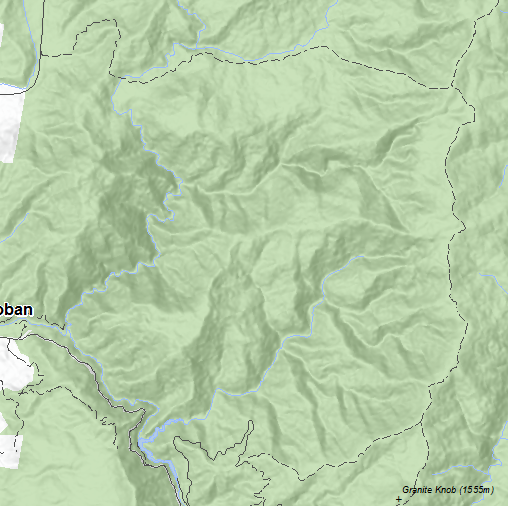
With the 'hillshade' option de-selected above, the issue goes away. With it selected, it appears. With some tweaking of stretching, min/max values and transparency, I've ended up with a pretty good looking result (at least in my opinion!)
- Mark as New
- Bookmark
- Subscribe
- Mute
- Subscribe to RSS Feed
- Permalink
- Report Inappropriate Content
Looks good!
- Mark as New
- Bookmark
- Subscribe
- Mute
- Subscribe to RSS Feed
- Permalink
- Report Inappropriate Content
Hi there,
I seem to be having a similar issue. I am creating rasters (LAS Point Statistics As Raster, LAS Dataset To Raster, and Hillshade) from a LAS dataset in Pro 2.1. They are also creating these types of "borders" but it seems to related to the sampling value that I choose when creating the rasters. The smaller the value, the bigger the "border" lines are? What is weird is that this issue has only started when I upgraded to Pro 2.1 a few days ago (I have created rasters with the exact same data before and didn't have these "borders").
I also haven't been able to find the option to turn off the "use hillshade effect" in Pro.
Does anyone have any ideas as to what could have changed or how to fix it?
Thanks