- Home
- :
- All Communities
- :
- Products
- :
- Data Pipelines
- :
- Data Pipelines Blog
- :
- Workflow: Get started in Data Pipelines
Workflow: Get started in Data Pipelines
- Subscribe to RSS Feed
- Mark as New
- Mark as Read
- Bookmark
- Subscribe
- Printer Friendly Page
- Report Inappropriate Content
To help get started with using Data Pipelines, here is an example workflow you can follow to learn about a variety of different tools and features. In this workflow you will create a feature layer in ArcGIS Online containing new housing building permits enhanced with median household income in Seattle, Washington, USA.
The steps to complete this workflow include loading data from two different types of sources, cleaning up and filtering the data, performing a spatial join, and finally writing to a feature layer in ArcGIS Online. To learn more about Data Pipelines, visit the documentation.
Let's get started!
Step 1: To begin building the data pipeline, you’ll connect to the building permit dataset from Seattle’s open data website.
- Navigate to the Inputs list and choose Public URL to add it to the diagram. Configure the following parameters:
- Set URL to “https://data.seattle.gov/api/views/76t5-zqzr/rows.csv?accessType=DOWNLOAD”
- Set Data format to “CSV or delimited”
- Click the Preview button to inspect the dataset.
Step 2: Filter the dataset to only include new residential building permits.
- Add a filter by attribute tool from the Tools list and configure:
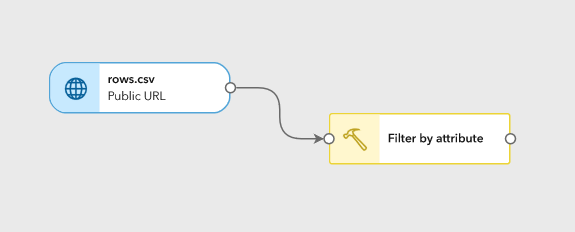
- Connect the Filter by attribute tool to the Public URL input from the previous step. Here is an image of what your data pipeline should look like after adding Filter by attribute:
- Click the Build new query button to add a filter expression
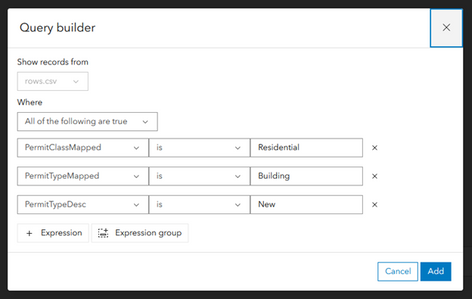
- In the Query builder dialog that appears, select Expression and click Next
- Configure the query as follows:
PermitClassMapped is Residential
PermitTypeMapped is Building
PermitTypeDesc is New
- Connect the Filter by attribute tool to the Public URL input from the previous step. Here is an image of what your data pipeline should look like after adding Filter by attribute:
6. Click Add to save the filter expression
7. Click the Preview button on the Filter by attribute tool pane to inspect the results
Step 3: Create a new point geometry from longitude and latitude fields to spatially enable the dataset.
- Add a Create geometry tool from the Tools list and configure as follows:
- Set Geometry type to "point”
- Set Geometry format to "XYZ"
- Set X field to "Longitude"
- Set Y field to "Latitude"
- Click the Preview button and navigate to the Map preview tab to explore the dataset.
Step 4: Add the census income survey dataset to the data pipeline. This dataset is hosted in Living Atlas.
- Add a Feature layer source from the Inputs list
- Click Select item
- Click My content and select Living Atlas in the dropdown menu that appears
- Search for and select Bureau of Labor Statistics Monthly Unemployment (latest 14 months)
- Click Confirm
- Set Layer to "Tract"
Step 5: Keep only the required data by selecting and renaming the median household income field.
- Add a Select fields tool from the Tool list
- Connect to Tract input added in the previous step
- Select "B19049_001E" (the income field we are interested in) and "shape"
- Add an Update fields tool
- Connect to Select fields tool added in the previous step
- Select "B19049_001E"
- Set New field name to median_household_income_12_months
- Your Updates parameter should now look like this:
Step 6: Now join the two datasets together with a spatial join using the building permit dataset’s newly created Point field, and the census dataset’s existing Polygon field.
- Add a Join tool from the Tools list, and configure as follows:
- Set Target dataset to "Create Point"
- Set Join dataset to "Update fields: 1"
- Enable Use spatial relationship
- Set Spatial relationship to "Within"
- Confirm that the geometry fields auto-populated
Step 7: Finally, write the result of the join to a feature layer.
- Add a Feature layer output from the Outputs list
- Confirm that Geometry field is set to GEOMETRY
- Set a unique Output name for the new feature layer
- Click Run in the diagram toolbar. This will process all of the data in both initial datasets, perform each operation, and write the data to the new feature layer.
- Once complete, click Output results and open the new layer in Map Viewer to explore the results.
Here's an example of what your final diagram will look like if you have been following along:
To recap, we've loaded data from two different sources, done some basic transformations, filtered and spatially enhanced a dataset, and spatially joined the two datasets. We then outputted the results of all this work to a new feature layer, ready for further use in Online. Nice!
Thanks for following along, and let us know if you would like to see additional content like this. We can't wait to see what you do with Data Pipelines!
You must be a registered user to add a comment. If you've already registered, sign in. Otherwise, register and sign in.


