- Home
- :
- All Communities
- :
- Events
- :
- FedGIS Conference
- :
- FedGIS Conference Blog
- :
- FedGIS 2020: Stories and Solutions for A Sustainab...
FedGIS 2020: Stories and Solutions for A Sustainable Future – Product Demo Highlights
- Subscribe to RSS Feed
- Mark as New
- Mark as Read
- Bookmark
- Subscribe
- Printer Friendly Page
- Report Inappropriate Content
After Jack’s plenary opening on Tuesday, FedGIS Conference attendees watched product demonstrations for the latest enhancements in ArcGIS and heard stories from public agencies who were using ArcGIS in their efforts to realize a sustainable future.
- Day 1 – February 11, 2020
- U.S. Department of Agriculture – Agricultural Research Service (USDA-ARS)
- ArcGIS Analytics for IoT
- ArcGIS Pro
- U.S. Environmental Protection Agency (EPA)
- ArcGIS Online
- U.S. Census Bureau
- ArcGIS Experience Builder
- ArcGIS Earth
- ArcGIS & Artificial Intelligence
- ArcGIS Mission
- ArcGIS in the Cloud and on the Edge
- The Y (YMCA)
- Day 2 – February 12, 2020 - Keynote Sessions
- NatureServe
- National Geospatial-Intelligence Agency (NGA)
Day 1 – February 11, 2020
U.S. Department of Agriculture – Agricultural Research Service (USDA-ARS)
The USDA-ARS opened the second half of the plenary with a video explaining how their organization is facing the challenge to feed 10 billion people by 2050. USDA-ARS created AgCROS, an ArcGIS Hub project, that enables researchers and individual farmers to unify siloed agricultural data across the country with technology from Esri and Microsoft. Learn how they use a standardized principle and mapping tools to create actionable insights to help them meet the challenge.
 ArcGIS Analytics for IoT
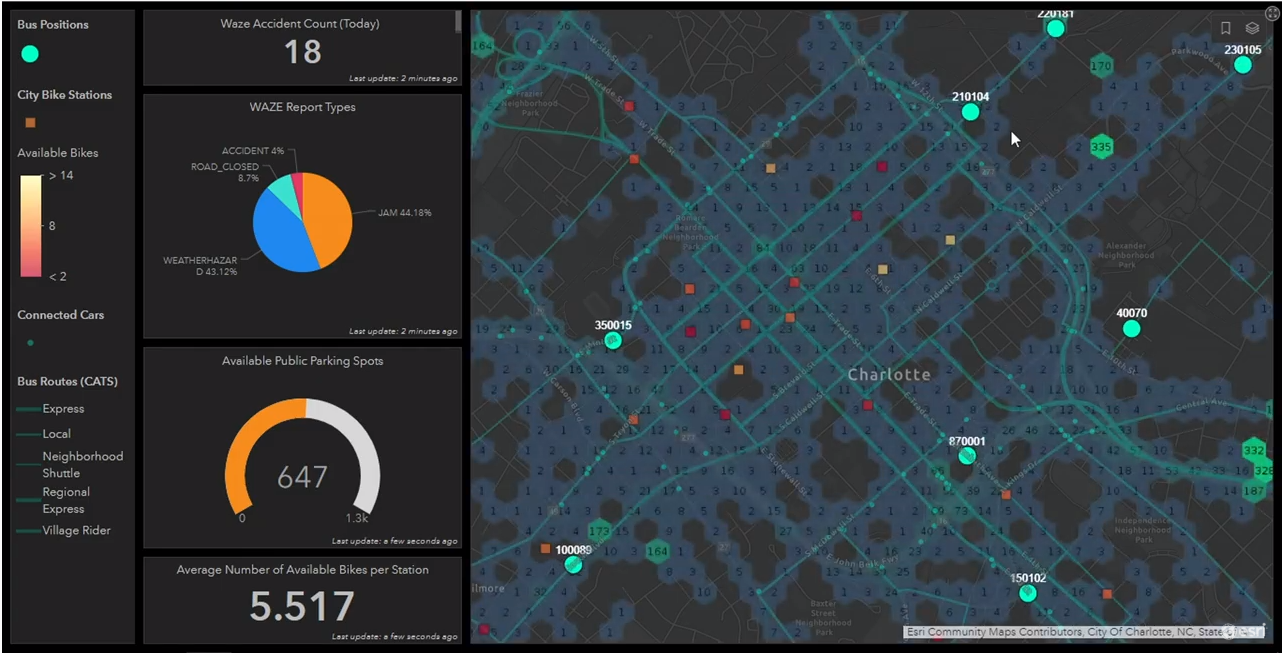
Suzanne Foss demonstrated how to use ArcGIS Analytics for IoT for cloud-based, real-time analysis and automated reporting with an example of transit information in Charlotte, North Carolina. Using data from Waze, anonymous vehicle data, social media, and other sources, analysts can access multiple layers of active transportation dynamics.
ArcGIS Pro
Ankhita Bakshi demonstrated six of several enhancements and new spatial analysis features made to ArcGIS Pro using weather data. The demonstrated enhancements included the find and replace feature in the table, a geoprocessing tool to count overlapping features, the integration of ArcGIS Notebooks, and a way to create chart symbology within the map. New spatial analysis features in ArcGIS Pro allow you to schedule analysis for real-time data, compare two maps, and more features that are beneficial for policy-making and multidimensional analysis on raster and imagery data.
U.S. Environmental Protection Agency (EPA)
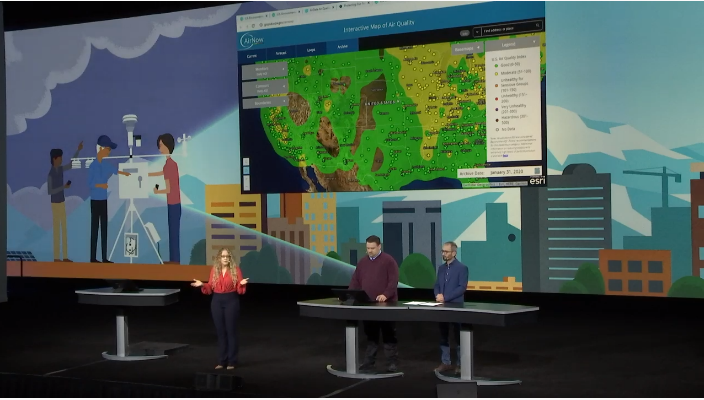 The Environmental Protection Agency’s (EPA) AirNow GIS hub empowers individuals to make informed decisions about their exposure to pollutants. In a new version of AirNow to be released in the future, users will be able to access the database to see air quality trends over time. To expand their awareness efforts, the EPA developed a community engagement program, where schools could raise colored flags that represent their local air quality levels from the AirNow database. Take a look at the future of AirNow and learn how the agency used Empirical Bayesian Kriging regression prediction in ArcGIS Pro.
ArcGIS Online
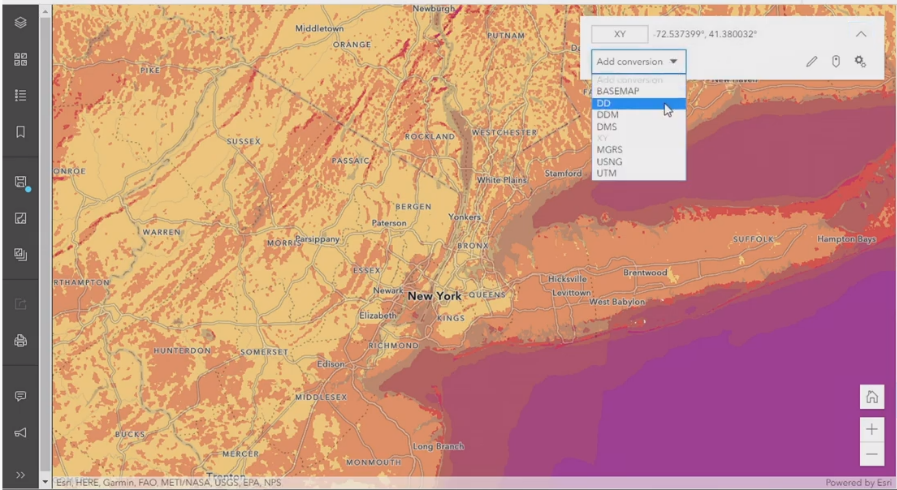 Katherine Smyth demonstrated new ArcGIS Online and ArcGIS Online Map Viewer Beta capabilities, including visualization techniques, accessibility optimization, and ways for administrators to communicate messages within the platform. Using a wind power data sample, Kathryn showed how to edit popups within the platform and explore multiple datasets.
See demo and follow the ArcGIS Online Map Viewer Beta space to learn about ongoing developments.
Pictured: Add location conversions to your map in the new ArcGIS Map Viewer Beta.
U.S. Census Bureau
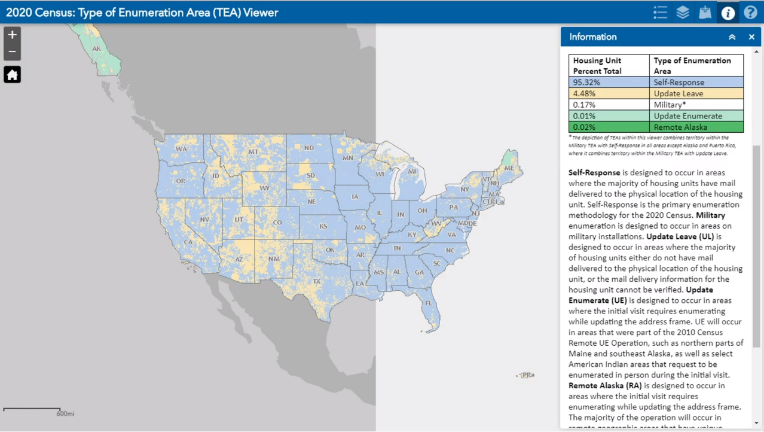 The United States Census Bureau is the leading statistical agency in the world. Their effort for “counting people once, only once, and in the right place” across the United States starts this year. Using web maps, they share their strategy for counting a billion people in the country by highlighting areas that require different approaches in rural areas, bilingual households, and non-responsive households. See how Census staff mapped the ways they plan to engage people.
ArcGIS Experience Builder
Kenyon Huber-Wilker showed attendees the ease of unifying web maps, Operations Dashboard for ArcGIS, Survey123 for ArcGIS, and ArcGIS StoryMaps in the recently released ArcGIS Experience Builder in ArcGIS Online. With a few drag and drop movements, Kenyon built a mobile responsive concept application that enabled employees to check-in their travel statuses, receive travel advisories, and provided managers an aggregate count and location of staff deployed around the world.
ArcGIS Earth
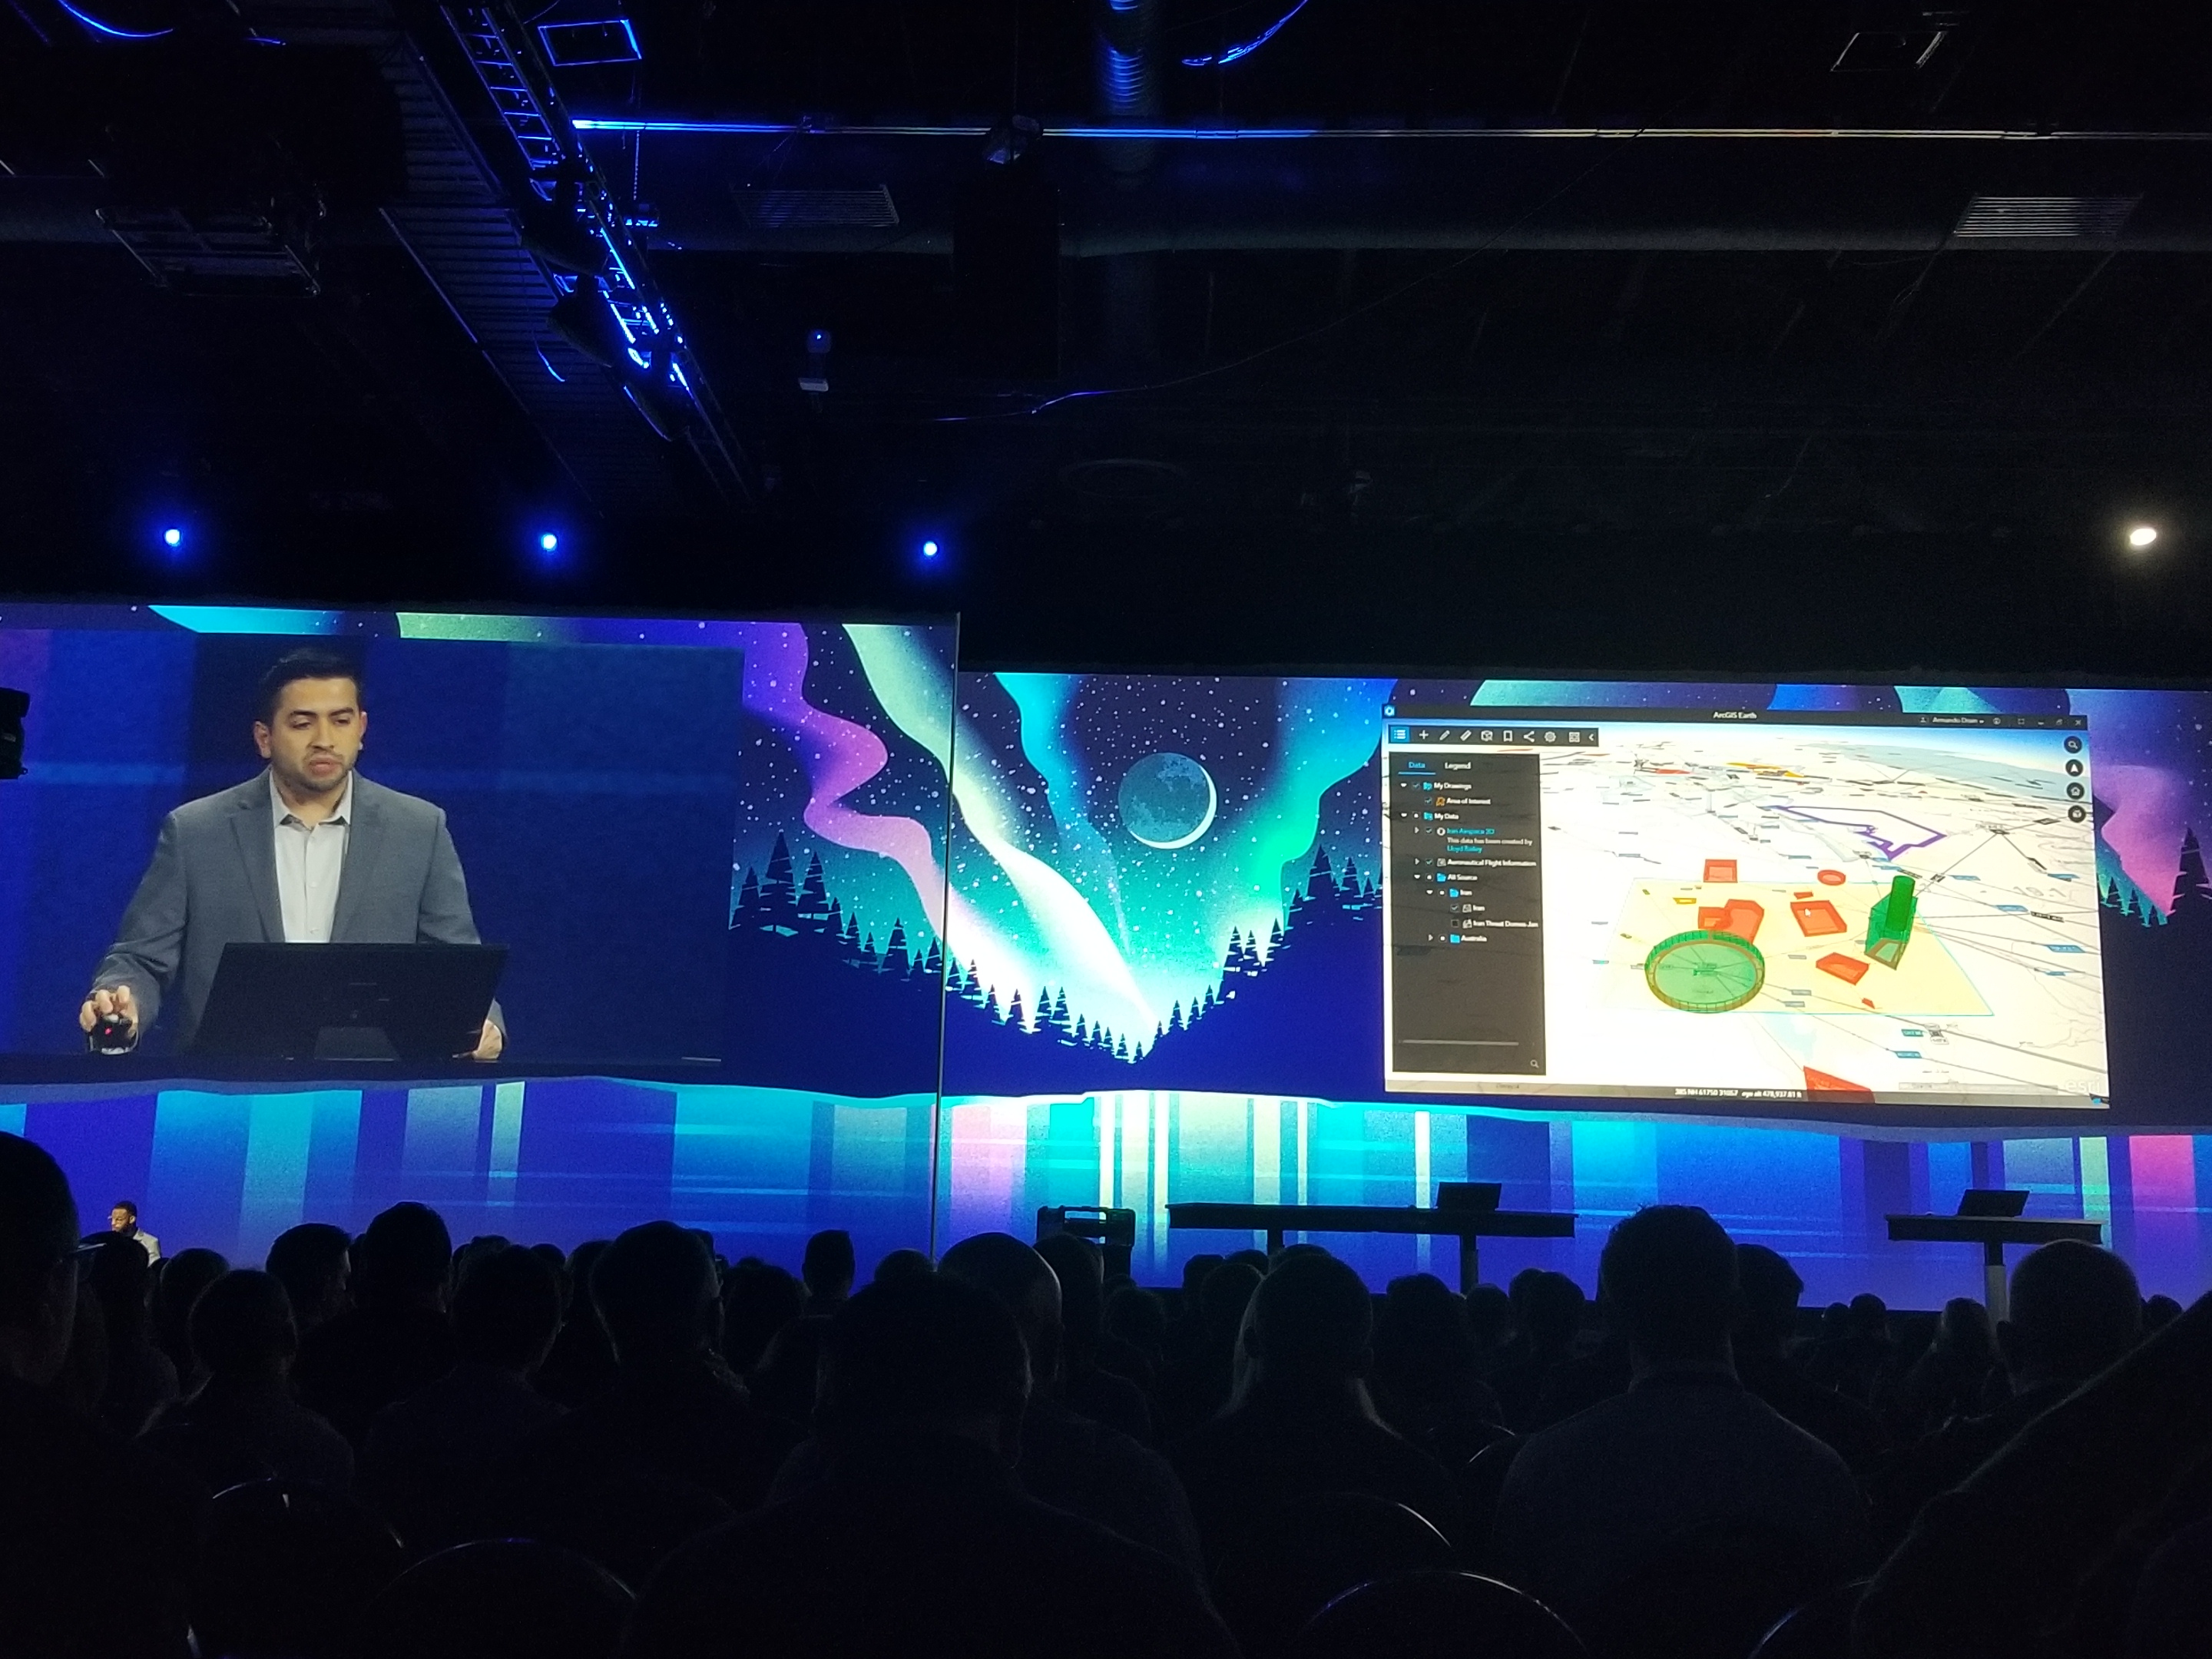 For 2D and 3D data analysis, ArcGIS Earth supports KML editing and exploratory analysis tools to draw, measure, and perform analysis. Users can also add annotations and contextual data. Watch Armando Drain demonstrate the new enhancements in this brief clip.
ArcGIS & Artificial Intelligence
 The Department of Defense’s (DoD) Joint Artificial Intelligence Center (JAIC) is using ArcGIS for smart disaster response through the Humanitarian Aid and Disaster Response Program (HADR). For example, when roads have debris obstruction or damage as a result of a natural disaster occurring, the DoD can use ArcGIS Pro’s AI modeling and imagery to detect debris and create new routes for first responder vehicles to access impacted areas. See how the JAIC uses ArcGIS Enterprise, ArcGIS Notebooks Beta - Online, and ArcGIS Pro
ArcGIS Mission
For Public Safety and tactical situational awareness in the field, ArcGIS Mission simulated a fictional mission at the convention center where the FedGIS Conference was held. Esri employees, including In a GIF blog writer Mike Schoelen, formed a team to find a person of interest around the event center. With ArcGIS Mission, the team leader organized information updates, tracked what ground was covered so far, and sent geomessages to the team to focus on specific areas around the convention center.
ArcGIS in the Cloud and on the Edge
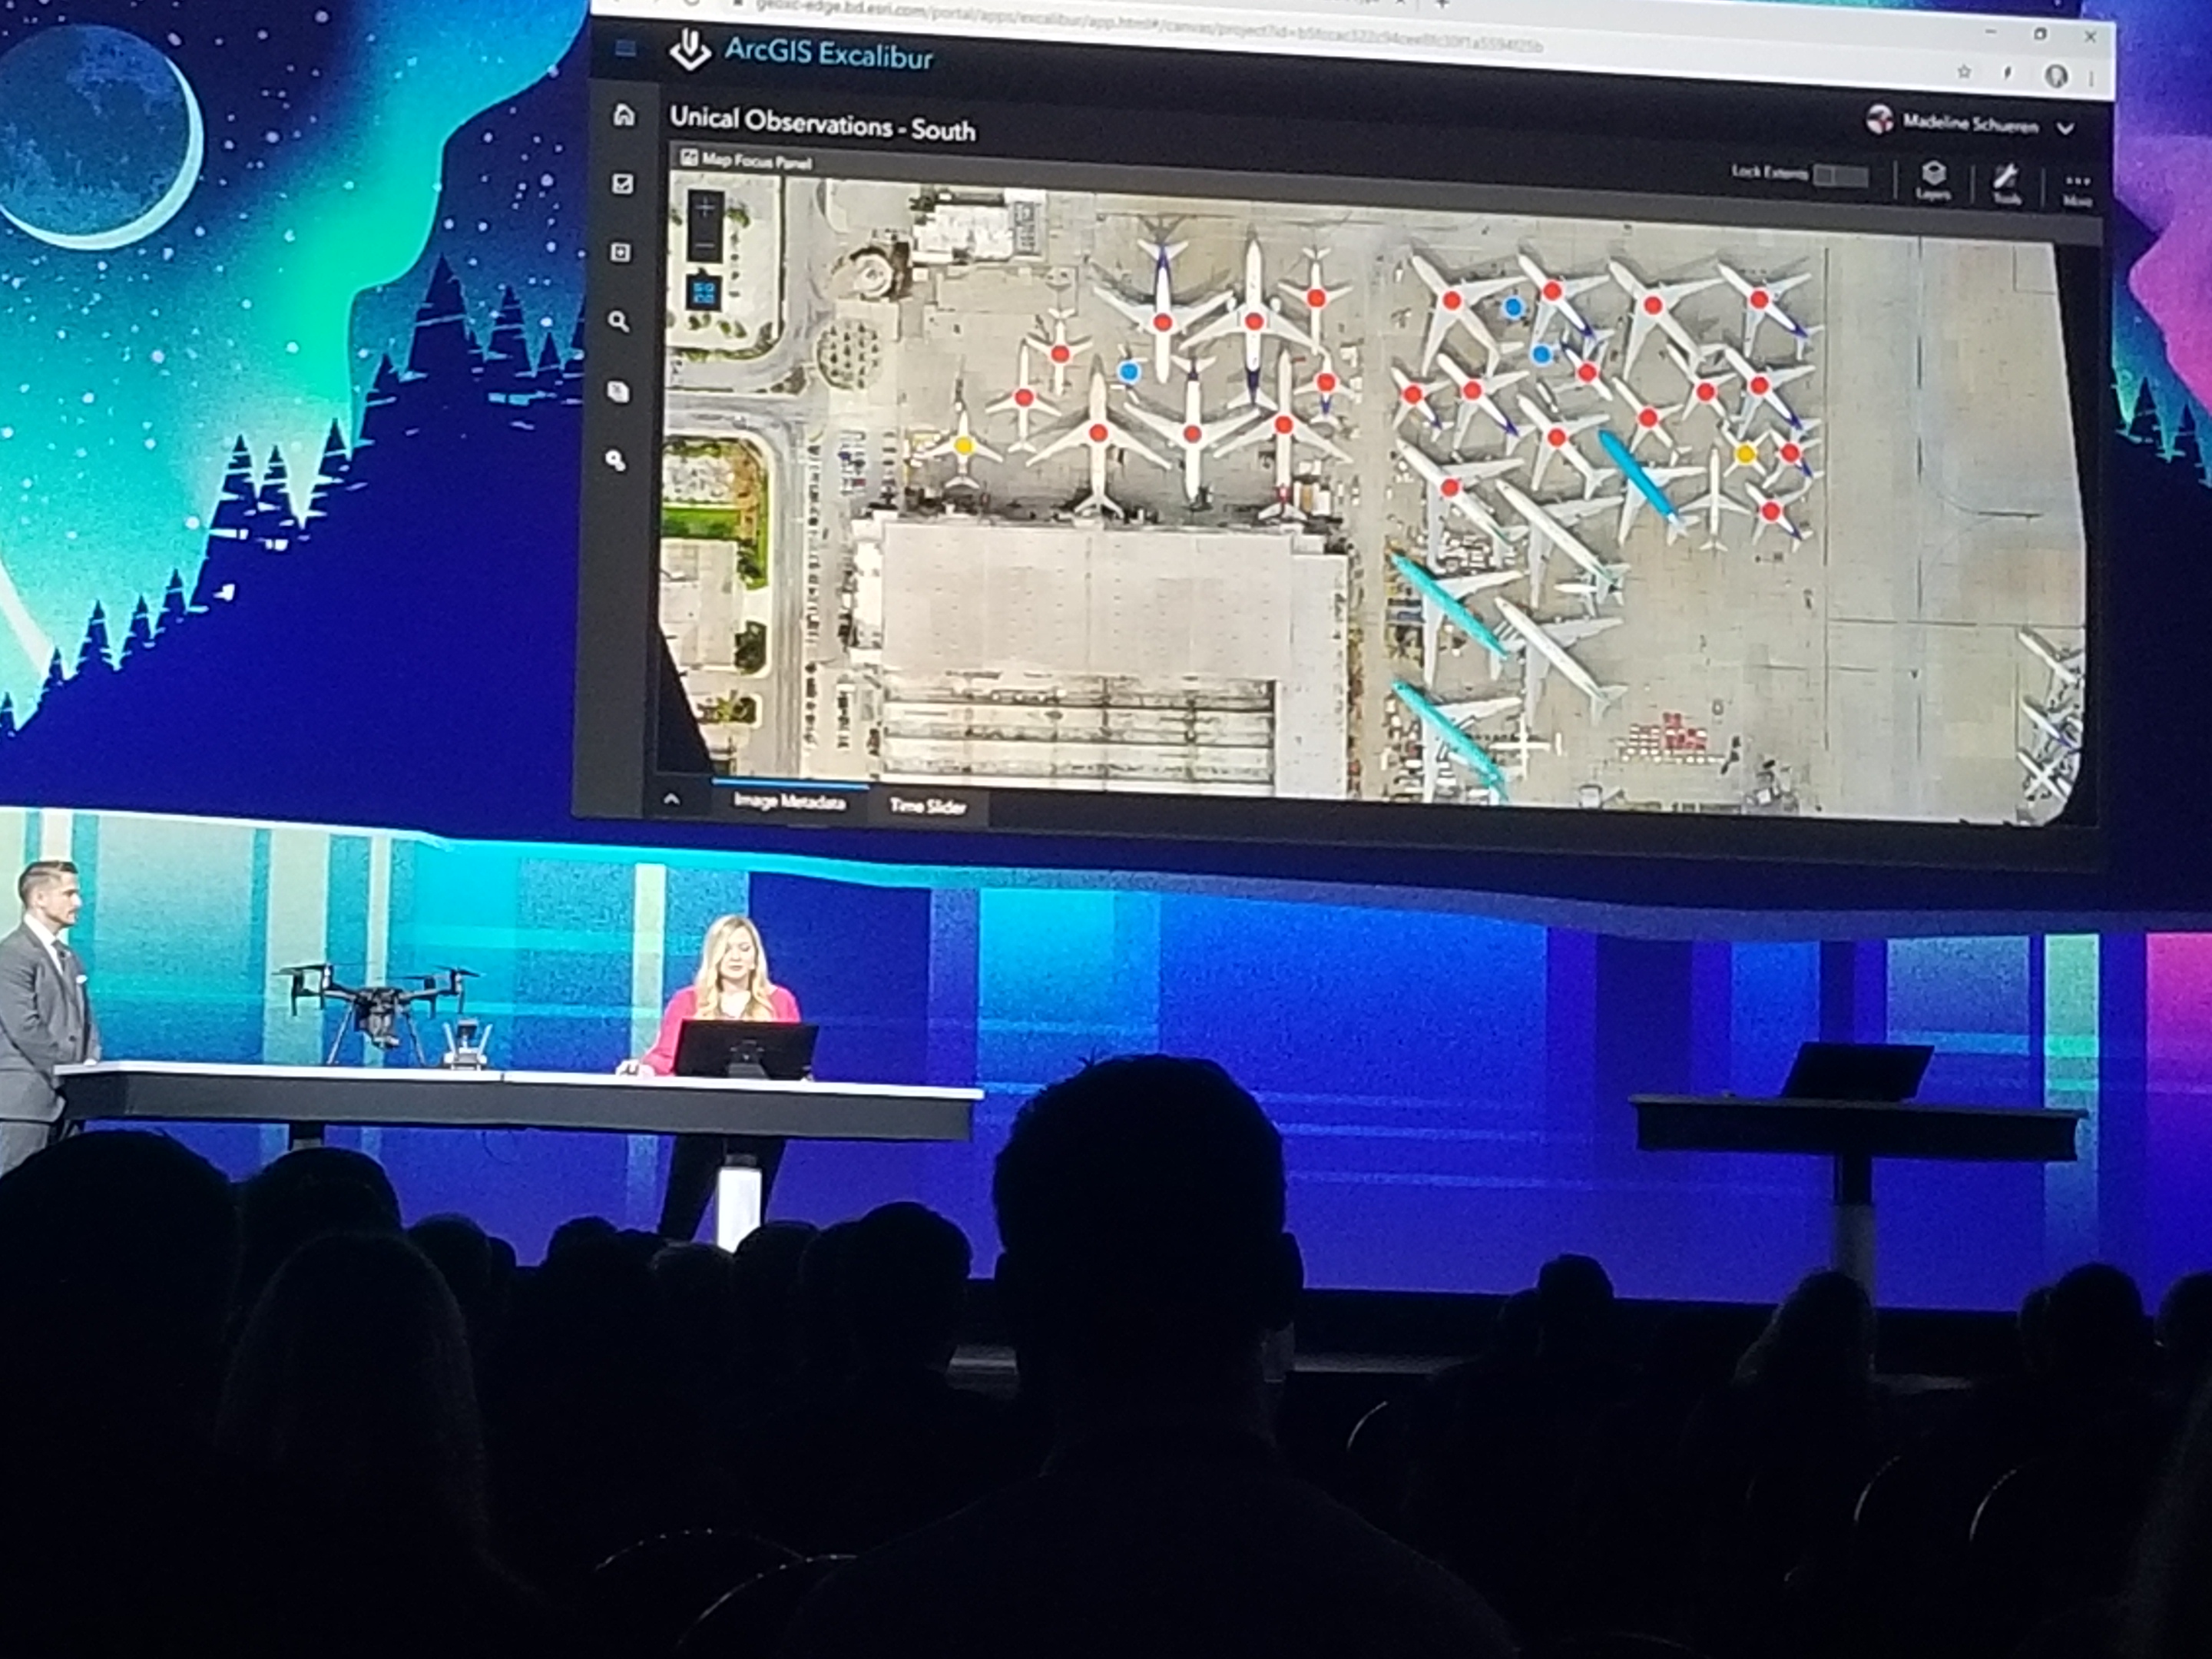 Madeline Schueren showed a few examples of how deep learning and Microsoft Azure Stack Edge technology can benefit field operations using ArcGIS. In her first example, she shows how Site Scan for ArcGIS supports drone flight plans and image processing from end-to-end in the cloud. Next, Madeline was able to document observations of airplanes in an airport and determine a plane model from afar using a measurement feature with ArcGIS Enterprise and ArcGIS Excalibur. Lastly, see Madeline use an image capture that enabled Survey123 for ArcGIS to preselect observation options and, in a separate example, determine how many people were at the beach with machine learning (pictured below).
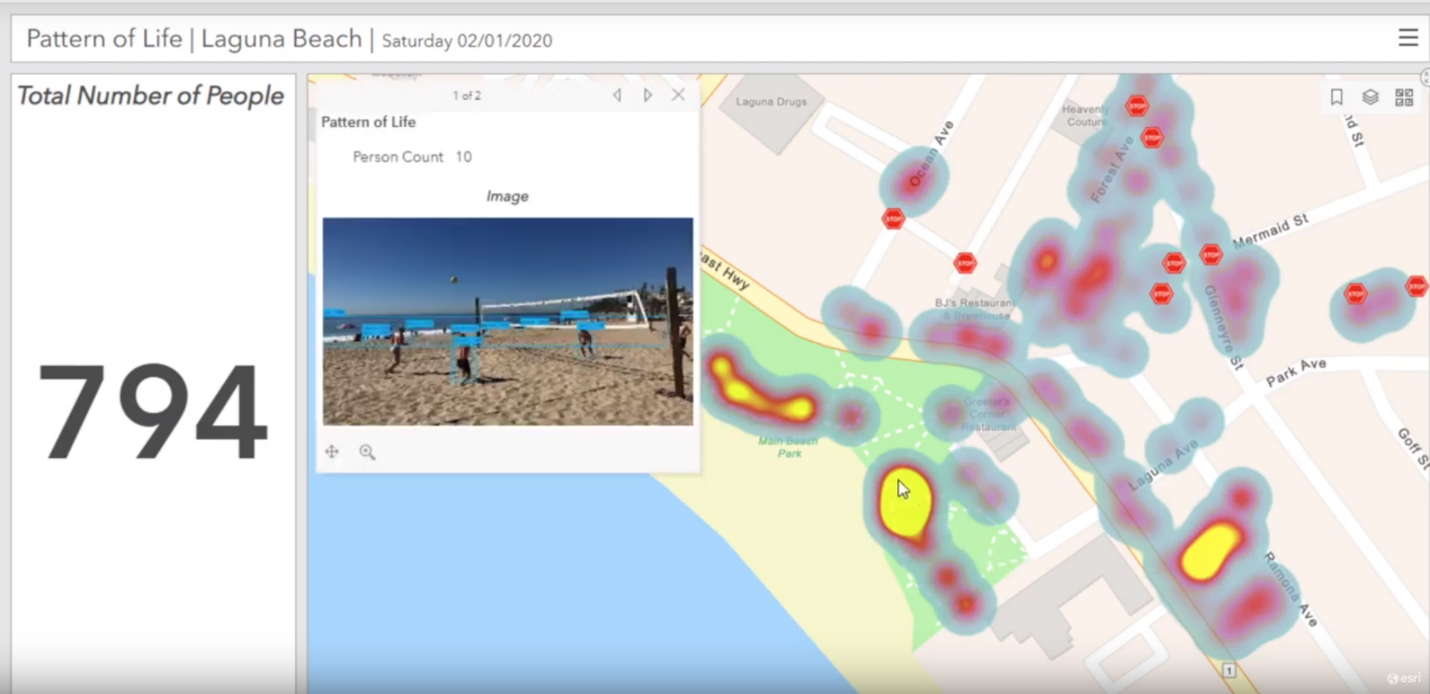
Picture: Photo captures with Survey123 for ArcGIS and deep learning can count people in an area and generate a heat map.
The Y (YMCA)
The conclusion of Day 1 ended with the strategic use of GIS in communities by The Y (YMCA), a national non-profit organization for community recreation and youth development. ArcGIS enriches their outreach by using data on local trends and changing demographics in their service areas for communication and program development. Learn how the YMCA enhanced their efforts to connect to the neighborhoods they serve.
Day 2 – February 12, 2020 - Keynote Sessions
 NatureServe
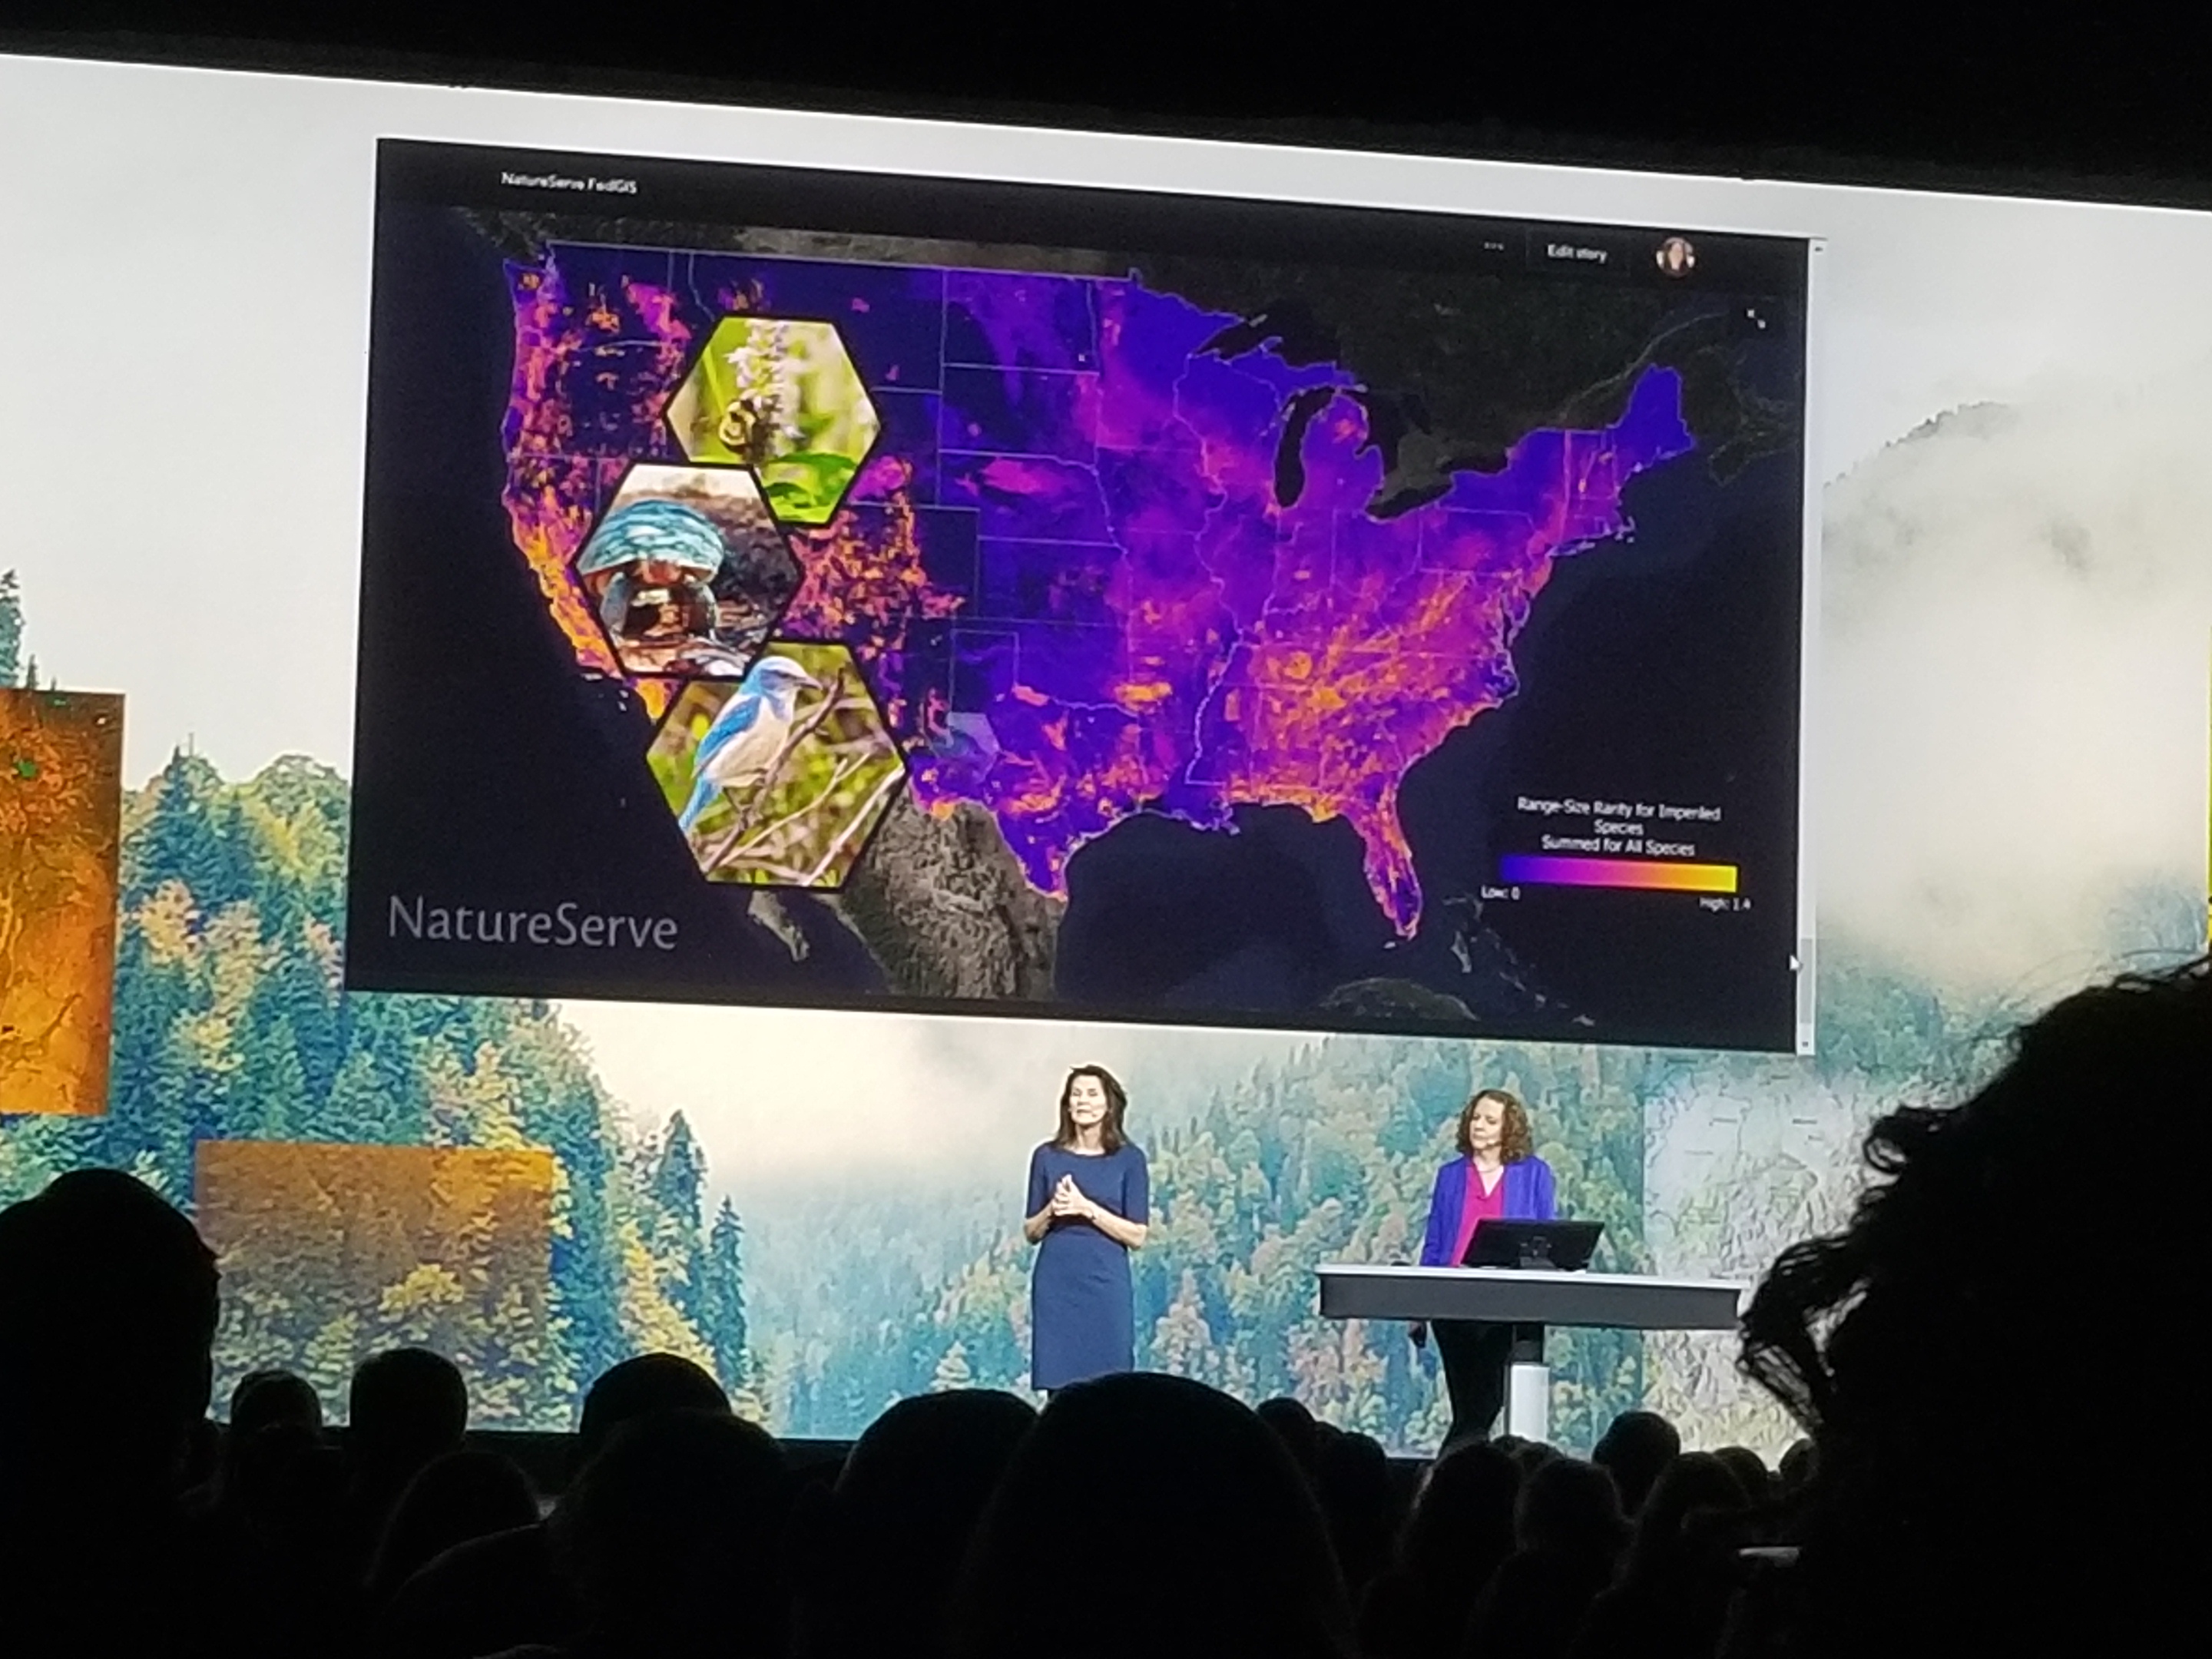
On Day 2, NatureServe announced the release of the Map of Biodiversity Importance (MoBI), the first high-resolution map of where more than 2,200 imperiled species are located in the United States. With NatureServe’s mapping efforts, industry professionals can learn about the environment and species that are native to areas in which they plan to engage. Reagan Smyth, Director of Spatial Analytics, walked through the ArcGIS and Microsoft cloud solutions that generate the maps and the science behind data.
View NatureServe’s Story and see the map in ArcGIS Living Atlas of the World

National Geospatial-Intelligence Agency (NGA)
Jack returned to the stage at the end of Day 2’s main stage activities to have a conversation with Vice Admiral Robert D. Sharp, Director of the National Geospatial-Intelligence Agency. In the conversation, Admiral Sharp talks about how he started with the agency, how he used geospatial technology in his work as an intelligence officer, the need for talent in the agency, and insights on how he transitioned into leadership by championing a strategy of "People, Partnerships, Mission Today and Mission Tomorrow." Learn more about his methods for GIS leadership and how the NGA is moving towards their competitive advantage as an agency.
- Tags:
- 2020 fedgis
- 2d
- 2d map
- 3d
- agcros
- agriculture
- agriculture research farm
- air quality
- air quality modelling
- analytics iot
- arcgis - enterprise
- arcgis analytics for iot
- arcgis earth
- arcgis excalibur
- arcgis experience builder
- arcgis hub
- arcgis living atlas
- arcgis mission
- arcgis notebooks
- arcgis online
- arcgis pro 2.5
- arcgis storymaps
- azure cloud
- cloud
- demographics
- ebk regression
- empirical bayesian kriging
- environmental protection agency
- epa
- esri federal gis conference
- executive leadership
- fedgis
- gis leadership
- heat maps
- jack dangermond
- kml
- live traffic
- map viewer beta
- mapping biodiversity
- microsoft azure
- microsoft edge
- mobi
- national geospatial intelligence agency
- natural disaster
- natureserve
- operations dashbord
- pollution
- precision agriculture
- predictive modeling
- public safety
- real time traffic
- social media integration
- survey123
- traffic and incident reporting
- transportation
- united states department of agriculture
- us census
- usda
- waze
- wind energy
- ymca
You must be a registered user to add a comment. If you've already registered, sign in. Otherwise, register and sign in.
-
FedGIS 2017
4 -
FedGIS 2018
5 -
FedGIS 2019
1 -
FedGIS 2020
3 -
FedGIS 2021
4 -
FedGIS 2023
4 -
FedGIS 2024
3