- Home
- :
- All Communities
- :
- Products
- :
- Imagery and Remote Sensing
- :
- Imagery Questions
- :
- Easy way to remove collars from GeoTIFF of USGS To...
- Subscribe to RSS Feed
- Mark Topic as New
- Mark Topic as Read
- Float this Topic for Current User
- Bookmark
- Subscribe
- Mute
- Printer Friendly Page
Easy way to remove collars from GeoTIFF of USGS Topo?
- Mark as New
- Bookmark
- Subscribe
- Mute
- Subscribe to RSS Feed
- Permalink
- Report Inappropriate Content
I have downloaded a lot of GeoTiffs of historical topo maps from the USGS (https://ngmdb.usgs.gov/topoview) at the 1:24000 scale. I am wanting to Mosaic these together to eventually clip to watershed boundaries, however the white collars on the outside are proving to be a headache. I have not been able to find a solid answer on these forums or anywhere else on the internet of how exactly to remove the collars.
Does anyone have an answer?
Any help would be appreciated!
- Mark as New
- Bookmark
- Subscribe
- Mute
- Subscribe to RSS Feed
- Permalink
- Report Inappropriate Content
page not found error
I don't imagine that it is as simple as clipping the collar. That would only be useful if the tiles matched at the edge when clipped. I suspect that there is some rotation and perhaps some overlap?
Perhaps you can provide some details as to whether there is overlap in the adjoining sheets and whether you can convert the 'collar' to nodata for use in a Con statement (details later)
- Mark as New
- Bookmark
- Subscribe
- Mute
- Subscribe to RSS Feed
- Permalink
- Report Inappropriate Content
The "n" and "g" the the beginning of the URL are switched, it should be this: https://ngmdb.usgs.gov/topoview/
I just download 2 adjacent tiles and see what you mean there is overlap since the maps include all the legend and metadata too:

However, you could script a solution with Python. In the xml file of the data you will see information on the boundng box of the actual data:

Which corresponds to the map (looking at a corner):

So you could for each TIFF read the bounding box from the xml data and apply an Extract by Rectangle—Help | ArcGIS Desktop to get the part you are interested in.
- Mark as New
- Bookmark
- Subscribe
- Mute
- Subscribe to RSS Feed
- Permalink
- Report Inappropriate Content
In additional, you would have to transform the decimal degrees from the bounding box to North_American_1927_Polyconic, since the tiles have projected coordinates. See the worldfile (tfw):

and the coordinate files (.prj)
- Mark as New
- Bookmark
- Subscribe
- Mute
- Subscribe to RSS Feed
- Permalink
- Report Inappropriate Content
Okay, so I figured out how to open the files and actually successfully executed the extract by rectangle in Python. However, the output is just blank. So im thinking the bounding box coordinates are the extent of the whole image including the white collar? Not entirely sure. How would you successfully extract just the image?
- Mark as New
- Bookmark
- Subscribe
- Mute
- Subscribe to RSS Feed
- Permalink
- Report Inappropriate Content
In order to extract the rectangle correctly you would have to specify the rectangle using the coordinates of the TIFF (the projected coordinates and not the geographic coordinates). To do this right you would have to project the decimal degrees found in the xml to the coordinate system "North_American_1927_Polyconic" (at least that is the coordinate system from the example tiles I downloaded). The challenge here might be the fact that this projected coordinate system is not a standard coordinate system recognized by ArcGIS as shown below:

Now it seems to be aligning with the basemap if I use the first transformation offered to me:

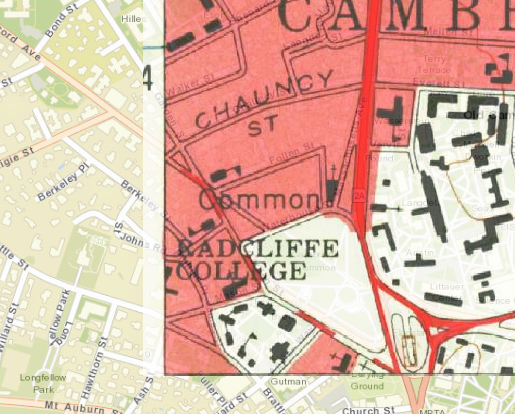
... and some changes through the years in the flow of the river become clear:

If I have some time, I will see what I can come up with to process the data. This may take some time though.
- Mark as New
- Bookmark
- Subscribe
- Mute
- Subscribe to RSS Feed
- Permalink
- Report Inappropriate Content
Hi Sean Wineland ,
Just tried something out on a single TIFF, but I am a bit disappointed by the result, since a strip of white remains on the left side, probably since the coordinates may not have been transformed correctly:
Find below the code I used:
def main():
import arcpy
tiff_in = r'C:\GeoNet\TopoView\MA_Boston North_350031_1956_24000_geo.tif'
tiff_out = r'C:\GeoNet\TopoView\tiff\MA350031.tif'
fc_out = r'C:\GeoNet\TopoView\test.gdb\polygon_rectangle'
sr_xml = arcpy.SpatialReference(4326)
trans = "NAD_1927_To_WGS_1984_3"
xml_file = tiff_in + ".xml"
prj_file = tiff_in + ".prj"
sr_tif = arcpy.SpatialReference(prj_file)
polygon = getRectanglePolygon(xml_file, sr_xml, sr_tif, trans)
arcpy.CopyFeatures_management([polygon], fc_out)
rectangle_extent = "{0} {1} {2} {3}".format(polygon.extent.XMin, polygon.extent.YMin, polygon.extent.XMax, polygon.extent.YMax)
arcpy.Clip_management(in_raster=tiff_in, rectangle=rectangle_extent,
out_raster=tiff_out, in_template_dataset=fc_out,
nodata_value="256", clipping_geometry="NONE",
maintain_clipping_extent="NO_MAINTAIN_EXTENT")
def getRectanglePolygon(xml_file, sr_in, sr_out, trans):
dct_bounding = getBoundingCoords(xml_file)
polygon = createPolygonFromCoords(dct_bounding, sr_in, sr_out, trans)
return polygon
def getBoundingCoords(xml_file):
lst_tags = ["westbc", "eastbc", "northbc", "southbc"]
dct = {}
with open(xml_file, 'r') as f:
for line in f:
line = line.replace("\n", "")
for tag in lst_tags:
if tag in line:
val = getValue(line, tag)
dct[tag] = val
return dct
def createPolygonFromCoords(dct, sr_in, sr_out, trans):
xmin = dct["westbc"]
xmax = dct["eastbc"]
ymin = dct["southbc"]
ymax = dct["northbc"]
lst_pnt_in = [arcpy.Point(xmin, ymin), arcpy.Point(xmin, ymax),
arcpy.Point(xmax, ymax), arcpy.Point(xmax, ymin),
arcpy.Point(xmin, ymin)]
lst_pntg_in = [arcpy.PointGeometry(pnt, sr_in) for pnt in lst_pnt_in]
lst_pntg_out = [pntg.projectAs(sr_out, trans) for pntg in lst_pntg_in]
lst_pnt_out = [pntg.firstPoint for pntg in lst_pntg_out]
return arcpy.Polygon(arcpy.Array(lst_pnt_out), sr_out)
def getValue(line, tag):
start_tag = "<{0}>".format(tag)
end_tag = "</{0}>".format(tag)
pos1 = line.find(start_tag)
pos2 = line.find(end_tag)
txt = line[pos1 + len(start_tag):pos2]
return float(txt)
if __name__ == '__main__':
main()This could be place in a loop to run through the TIFF files you have, but first the possible shift in coordinates should be examined and corrected.
- Mark as New
- Bookmark
- Subscribe
- Mute
- Subscribe to RSS Feed
- Permalink
- Report Inappropriate Content
The Clip_management tool may be a better choice. Especially since the edge of the quad is not a rectangle - it's a polygon - which you would to generate and supply to the tool to clip to the edge of the map.
- Mark as New
- Bookmark
- Subscribe
- Mute
- Subscribe to RSS Feed
- Permalink
- Report Inappropriate Content
Thanks for your reply! I have never used python before, I have only ever done simple geoprocessing in ArcMap. Where do I find the .xml and .prj files and how would I do the transformation you are talking about?
- Mark as New
- Bookmark
- Subscribe
- Mute
- Subscribe to RSS Feed
- Permalink
- Report Inappropriate Content
If you aren't picky about dates on the historical topos, this same information is available in the basemaps Esri provides, no collar issues. I would also look around local (state) websites, searching under the keyword "drg" for data stores of collar-clipped DRGs. It is extremely likely this has been done and the data is available for your area.