- Home
- :
- All Communities
- :
- Industries
- :
- Land Records and Valuation
- :
- Land Records and Valuation Questions
- :
- Parcel Fabric Adjustment (LSA)
- Subscribe to RSS Feed
- Mark Topic as New
- Mark Topic as Read
- Float this Topic for Current User
- Bookmark
- Subscribe
- Mute
- Printer Friendly Page
Parcel Fabric Adjustment (LSA)
- Mark as New
- Bookmark
- Subscribe
- Mute
- Subscribe to RSS Feed
- Permalink
- Report Inappropriate Content
Hello~
We have been in the parcel fabric for a couple years and all is well  Our data was computed when brought in to the fabric. We're now heading into our next phase of doing adjustments however we know we can't do adjustments on computed data. The plan is to get parcels updated with record data and start doing adjustments. We have great control in most areas.
I'm getting started now and have my test area. I've added the record data and accuracy to everything I can in my test area. After that I did an adjustment to approx. 285 Lots & Units, 192 Tax Parcels, 25 Subdivisions and 2 Encumbrances....and it failed miserably. I reviewed the log, fixed the points then tried to fix the lines that were bombing out (the ones that had the double pound sign which I read is a fatal error, guaranteed to fail the adjustment). The only thing I knew to do to keep these lines from creating the fatal error, was to change their accuracy to a 7 - a non participant in the adjustment. This is not ideal but for now, and to get a successful adjustment, it seemed the right thing to do. Still my adjustment fails. My next step was to focus on a smaller area. This next adjustment is approx. 39 Lots & Units, 20 Tax Parcels and 3 Subdivisions. I had a couple fatal errors that were easy to identify (and taught me a little more about line types - Precise Connect vs Orig Connect vs Connection lines). I fixed those lines and adjusted again. Now the adjustment is taking over an hour and it looks like every single line was the double pound sign fatal error.
I'm not sure what I'm doing wrong. I'm looking for any tips and tricks. I've read the best practices and ideas for data that is poor quality. It suggests starting with some new parcel data then adjust around the new parcel(s) however we want to bring our poor data up to good data then be able to adjust from there. That seems like a reasonable plan.
Some of what I'd like to discuss include:
How important are the attributes of the lines, as in the Computed field? If I've changed the line to reflect the record, do I have to go back to every line and change to 'Computed = No'?
Does the line type have to match the poly type? We've been guilty of creating a TaxParcel and "oops! that should have been a Lot not a TaxParcel" and we've only changed the attributes of the poly. Is that a big no-no??
I also notice that 'ParcelType' field in our Line table has Nulls, '0' and '-1' (<--that doesn't seem right).
This is enough to get the conversation started and hopefully answer some questions. Please let me know how it's going for anyone who is having success and your best advice
Thanks much!
~Betty
- Mark as New
- Bookmark
- Subscribe
- Mute
- Subscribe to RSS Feed
- Permalink
- Report Inappropriate Content
Betty,
Thanks for starting this discussion. It sounds like you’ve made a good start by updating your lines to the original record data. Having the adjustment fail when first running it is fairly normal/expected; the reported results can be used for QA and to better understand your data, and to choose a Distance Residual tolerance, as described below. Of course you should not expect to see things in the report get worse after making changes to the parcel data. I’d like to help you figure that out, and I may contact you to get your data, but in the meantime here are some answers to your questions.
With fabric adjustment you’re making a best fit of all the record data by matching it to the control points. The adjustment will create a balance between the control point positions of a few good known locations in a network, and the COGO record values on all of the lines used in that adjustment. If there is a significant mismatch in making this balance, it could be due to one or more of the control points, or one or more of the record distances or bearings. The control point may be out of sync if it is not referenced to the correct fabric point. I’ll go through the information that is important for the adjustment, and the attributes that affect the adjustment versus attributes that do not directly impact the adjustment.
The following attributes impact the adjustment directly: Accuracy (on plan, parcel and lines tables), Bearing, Distance, Radius, and Category, (on lines) the X Y Z coordinate attributes (on control), and true-mid-bearing flag (on plans). All the other attributes are computed information, or are non-spatial cadastral information. The line category attributes are related to parcel structure (example boundary lines, connection lines etc.); the adjustment will report parcels without the correct structure, but it is not very common to run into this problem.
For the plan table, the accuracy value is required, and it has a direct impact on fabric adjustment results. Aside from true-mid-bearing setting, it’s the only attribute for Plans that can be changed to affect adjustment results. You should set that accuracy to the level that matches the survey date of the subdivision/plat/deed etc. (see doc). Similarly, for parcels, the accuracy category is the sole attribute that will affect adjustment, however the attribute is null by default and the accuracy is inherited from the plan when running an adjustment. You will most likely not need to manually add an accuracy value to the parcel, unless you want to explicitly over-ride the value inherited from the Plan (this should be rare). Also for lines, accuracy category is null by default and is inherited from the Parcel or Plan, but it can be set directly for a line in order to over-ride the value it’d otherwise inherit. (Setting accuracy on a line is a bit less rare, see tips below on Accuracy values.)
Tips on using Accuracy category values (1 through 7)
Setting lines to accuracy 7 is like removing the line completely, so while this is OK for some lines, for others it may be a problem as it could weaken the network, or break network connectivity. In general, setting accuracy should be done at the Plan level, and should be set based on the date of survey, as defined in the accuracy table description (see doc: About accuracy—Help | ArcGIS for Desktop )
You typically should not have to change accuracy on individual parcels or lines. However, if you’d like to reduce the influence of a particular line to the lowest possible without breaking connectivity, then use accuracy category 6 instead.
More about accuracy category 7: There are some valid cases for setting accuracy 7, such as for long lines that you did not directly COGO in, such as radial lines that are not part of a cul-de-sac, or part connector lines that are (typically) system generated, but as mentioned, be aware that this can break connectivity.
Tips on control points
Add elevation data to the control points. Make sure that the control points that you are using have elevation values (z values) populated. They do not have to be very accurate elevations, so if you have control points that do not have a Z, then you can add the standard topographic base map to your map, and use the elevation from the nearest topographic layer contour, nearest spot height, or bench-mark. Note that the units of the elevation may have to be converted when using this technique. This is important because the record distances are presumed to be ground values, and the adjustment will use the elevation information on the control points to compute the combined scale factor. Without this factor applied, you are more likely to have lines that are detected as outliers, even though they are actually good record values. The distribution of the control points should not be such that the control is bunched together in one area of the network. Rather they should be well distributed and, as a very approximate rule of thumb, ratios of control points to parcels can range between 1:20 to 1:200.
Tips on overlapping parcels
When you have Lots and Units, and the Tax Parcels are a direct duplicate of these Lots and Units, and share the same points, then it is not necessary to select the lots as well as the tax parcels when running the adjustment.
This just increases the amount of data that the adjustment processes. Although it is important for there to be lots of redundant information in the adjustment, it is not meaningful if it is just duplicated overlapping lines, with the same record values. Since the fabric points are shared between the lots and tax parcels, all parcels connected to those points will still be adjusted even though they may not have been directly participating in the adjustment. So for these cases you can choose to minimize what the adjustment processes by turning off selection for the layers that have the duplicate parcels, and only selecting the Lots, for example.
Tips on Connectivity and line categories
Sometimes you can have data where there are fabric points very close together and that are not connected with a line. These points should be averaged/merged using the mean point tools, or else the parcel should be re-joined so that this connectivity is created.
Tips on reading the report
After running the adjustment, it’s useful to temporarily save the report file, and refer to it when going back into the data to check on the reported items, and make changes as needed. As mentioned before, the adjustment report is a good way to QA your data, and find possible data entry problems, or connectivity (topological) problems. The double hash “##” next to a value in the report indicates that the record value for that line does not match well with the other measurements in that part of the network. This means that there may be a possible mistake in the data at this location, such as a mistyped bearing or distance, or a transposed number on the actual record, and so on.
If you see the “##” next to bearing values, then it is likely that it is a radial line, a connection line, origin connection line, or a part connector line that has a bearing that does not have a correct bearing with respect to the parcel it’s attached to. This can happen when there is a rotation on a parcel.
Tips on the adjustment tolerance
The Distance Residual tolerance is the value that is most typically changed to get an adjustment to complete. The default value is 0.348 feet (0.1meters.) If you see a ‘##’ next to a distance value, look at the residual value, and divide by 3. This is a rule of thumb for determining an initial value to use. However, if you find you are making this value very high (more than 25 feet) then there are likely other problems that need to be resolved.
There are a few things that may need to be expanded on, and this should hopefully keep the discussion going.
-Tim
- Mark as New
- Bookmark
- Subscribe
- Mute
- Subscribe to RSS Feed
- Permalink
- Report Inappropriate Content
Thanks Tim! Your reply was very helpful. I made some discoveries and some changes from your information. Plus I found the reason I was getting a '##' on every line after I got my first successful adjustment. I had to re-joined a parcel to a control point and it sent the control point up into Canada (maybe not that far, but it was far, far away!) All of my lines were then 10s of 1,000s of feet off. No wonder everything was suddenly out of whack!
Once I fixed the XYs of the control point the adjustment was great. I continued doing small areas of my test section, moving from the oldest to the newest subdivisions and had continued success until...... 
I hit a problem area. I do get a successful adjustment but when the parcels adjust, it moves a couple parcels in a way that is unacceptable. I cleaned up some errors (Invalid line categories in particular) and got the same or similar results. I've narrowed it down to 4 points that are adjusting 3 to 7+feet. I reviewed the common N-S lines and made their bearings the same direction (some were going NW/SE and others NE/SW) All are now NE/SW except for my one record parcel. The reason I didn't make all parcels of the one direction is because I have an old, old plat without bearings and a newer plat with a NE/SW bearing (the source of my decision to go with the NE/SW directions). But I do have a record description within the old, old plat that has a NW/SE bearing. The newer plat and the record description are about 150' apart.
My next suspect that I thought might be causing a problem is a common line with a road r/w from within the old, old plat. I unjoined the r/w but the adjustment results were the same.
I know it is difficult to follow my diatribe and I've included 2 screen shots that I hope will help paint a picture of what I'm trying to explain:
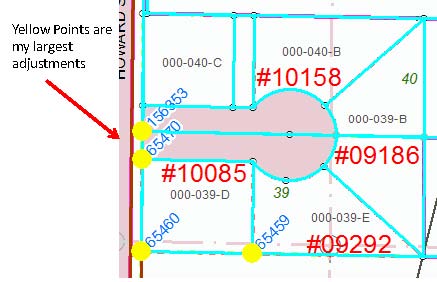
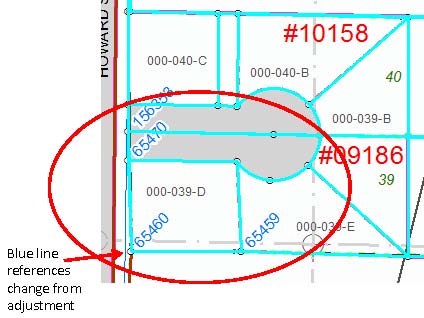
The image on the left (or top - with the yellow points highlighted) is pre-adjustment with the points that have the largest movement highlighted. The image on the right shows where Point OID 65460 & 65459 moved the most. The other two still moved 3+ ft.
I am having a hard time determining why those points adjusted so far. Everything measures close to record distance (where there is record). I've checked everything within the parcels and their adjoiners. I've re-joined them hoping that would help. The only other issue I'm not sure how to resolve, and I don't know how much it could be contributing to this movement, is the radial lines for the parcel labeled '#09186' and it's overlaying TaxParcel. The radial lines into the cul de sac are listed as 'Incorrect Category - Radial' in the adjustment report. Hmmmm....I'm pretty sure they're radial lines!  However their bearings pretty much match the lines leading to the point of curve on both sides. Not much I can do about that.
This is only about a quarter of the total parcels included in this adjustment. I can't adjust this area alone as it does not have joins to control points. The parcels and small subdivision to the north have the control connections.
The other (smaller) issue at this time is...why do my control points' XY coords change so radically when I join, or re-join, a parcel to it? Per Tim's note, I added a Z value to the control points that were Null hoping that would help.
Suggestions anyone? Could this be related to something outside of the area of adjustment, a parcel that is not in my selection? Maybe the accuracy attribute is an issue? The parcel labeled '#10085' and its overlaying TaxParcel have an accuracy of 3, the underlying lot labeled '39' is Null but its related plan is a 6 (also related to this plan is the r/w which I unjoined) . I assume this is ok as the lot & r/w will inherit from the plan's accuracy.
Looking forward to any ideas or suggestions.
Thanks again!
~betty
- Mark as New
- Bookmark
- Subscribe
- Mute
- Subscribe to RSS Feed
- Permalink
- Report Inappropriate Content
Hi Betty,
The problem with the Control point moving when joining has been fixed, and was also released in a patch for 10.3. Do you have the latest patches installed? See: Patches and Service Pack - Esri Support
Also, the message about the radial lines is a known problem, but it does not affect the end result, the message is just incorrect, and it typically occurs when there are origin connections attached to the parcel. That is also fixed in 10.4.
Regarding the problem of the bends in the lines; is there any rotation on the parcels? Also, you inferred that for some of the lines you do not have record values. For those, did you set the line accuracy to a 6? If you have concerns about one, some, or all of the radial lines within the cul-de-sac, then you could set one or more to accuracy 7, and see if that improves the result. If necessary and in order to maintain the structure of the cul-de-sac, you could also set ALL the radial lines in the cul-de-sac to accuracy category 7, but then work out the correct radial bearing and distances, and add 3 or 4 connection lines to serve as radial lines. When creating connection lines, the bearings always go in a direction outward, away from the parcel, and be sure to make the bearings on the connection lines be relative to the parcel that they are connected to. (Related note, for origin connections the bearings go the other way, 180 degrees different, lines proceed in sequence in towards the parcel.)
Do you notice high computed minus observed (c-o) residuals, and what are you using for your Distance Residual Tolerance? You could start to set that tolerance lower, until you force it to report a failure, so that you look for the '##' again as it may provide some clues. Also check if you have any Close points reported, and if you do you can use the mean points tool to merge them.
Also take a look at long lines that are not boundary lines, because error/mistakes in those lines are magnified compared to the shorter lines, and they also don't show up in the parcel misclose information. Double-check to make sure their distances are in ground, and confirm that their bearings are a match with the rest of the parcel relative to the parcel's rotation. One quick way to do this is to open the parcel with a long connection line and use measurement view to see if the line goes off at an unexpected angle. Are there any multi-part parcels, or parcels with inner rings (donut parcels)? If so check the part connector bearings.
Also, regarding the control points. The bending of the lines could be due to an ill-fit with the control points. How many control points and parcels in this adjustment? You can do a check-fit on the control dialog to see if there are any significant outliers in the control points. Find the largest outlier, de-activate it, then re-run the check-fit. This way you can try to find any potential problem control points. This is does not work as well for parcel data that has a lot of initial distortion. It's not necessarily a good idea to de-activate multiple control points at once, so if you find a possible bad control points, de-activate just the one with the highest residuals from the check-fit, then run the adjustment...etc.
If you discover that although you know you have entered all good record bearings/distances, that somehow the system generated lines (that were not directly COGO'd) are inconsistent with the data you actually COGO'd, then take a look at the add-in called The Parcel Fabric Quality Control. The add-in will allow you to filter for big outliers, and inverse bearings and/or distances based on your filter settings, so as to keep the good/original entered record data intact. Of course, when inversing data proceed with caution(!) since it works off geometry, and so if the geometry is distorted the inversed data will not be as close to record as you'd like. The Parcel Fabric Quality Control add-in is here: http://arcg.is/1nRHU30 Once you've installed the add-in click the help button on the toolbar to see the details about how to use the different tolerances.
-Tim
- Mark as New
- Bookmark
- Subscribe
- Mute
- Subscribe to RSS Feed
- Permalink
- Report Inappropriate Content
Thanks once again Tim. Your information and points to my specific problem were invaluable! One of the biggest things I learned from your reply was the direction of Connection Lines. I like to use them when I have a connection between section corners, or other corners that aren't necessarily part of the Starting point to POB Origin Connections. That will be helpful moving forward. I also installed the patch.
So...here's what I did and here's what I found.
After your last reply I was able to get my one problem area (described above) fixed by working with the parcels to the N and S, editing their distances (merging courses, unjoining, editing and rejoining) and also fixing the Accuracy. I suspect that was one of my biggest problem. The parcels to the N and S were part of the plat that had little to no record information on it and I was saving its adjustment for last.
Once that problem area was fixed I moved on to the oldest plat. That plat originally took up the whole quarter section. Since its recordation (100+ years ago) there have been many plats cut out of it. When I started this journey I initially reviewed the lines common between the one old plat and the new plats. I populated the old with the new(er), since the old had little to no record information. I'm not sure that was a best practice looking back.
Because of all my editing I knew I had to rejoin the old plat and the original dedicated R/W in order to pick up line points I knew had been dropped along the way. In the course of rejoining I would find errors, fix them then go back to rejoin once again. One of my biggest problems was a 49220' radius curve along a highway. That curve gave me grieve in that the radial lines did not always get to the same radial point. The Mean point tool got a workout! In the end I was able to connect all the parcels that shared the curve (a dozen or so) to one radial point.
Finally it seemed I had fixed everything and rejoined the old plat & r/w and was ready to start the final adjustment stage. I would run the adjustment, fix an area with large distant errors, save, run the adjustment again, find more errors, fix, save, run until all I had left were Line point errors and fairly large distance residual which was due to the radial point. The final adjustment ended up with a 60' distance error (a 20' distance residual) because of that radial point. I did not know how to fix it without doing major adjustments to the parcels. My justification for keeping such a big residual was that as long as the radial lines are ending up at the radial point, and the radius is so dang long(!), 60' wouldn't reflect any huge difference in the map. The other errors were all pretty small however there really was a long list of Line point errors, nothing huge just a lot of them. I could tell they were primarily from the old plat and its r/w. I let it go!
All along, except for the radial point, most of the distant residuals were fairly low. I didn't have any Close points so that tells me I did a good job taking care of those on the front end. Without the old plat & r/w in the mix I never had more than one or two line point errors. I had four well fit control points, and other than the flinging to Canada, control points were never a problem.
If I were to do it over again, I would not set individual Accuracies on the parcel lines. I would let the Accuracy hierarchy rule, with exceptions of course (there will always be exceptions). I think I would edit the new plat, updating their data to record, then place the old plat in as 'new', meaning I would add it whole and cut the newer plats out of it. I think that would have saved me more time than it took to fix it along the way, primarily because this was converted data edited with record data which, I think, made the errors more prominent.
I hope all made sense and I hope anyone else out there getting their feet wet in the parcel fabric adjustments will get some good points and help from what I went through and what Tim shared. I think I will go back and use the Parcel Fabric Quality tool to see how that works and what the quality of my test area ended up to be.
After that, my next step is to write this up for my boss and find out where we go from here. I might want to try an area without so many parcels but maybe a few old plats and less control. I think I'm up for it!
- Mark as New
- Bookmark
- Subscribe
- Mute
- Subscribe to RSS Feed
- Permalink
- Report Inappropriate Content
One question I would ask is how do I use the Rotation and Scale information in adjustments? When I reviewed certain parcels after the adjustment their Rotation & Scale did not seem cause for concern however I did have one Lot with a 359-37-37 Rotation and others more in the 0 range of rotation. Scales ranged from 0.99 to 1.00 (ish)
When is there concern? It never seemed to be a problem for me but I might not have known what to look for. And while I'm asking, sometimes when I rejoin a parcel it flies out of view. I have to zoom out, sometimes quite are, to find the parcel and move it back in place. What causes that? The error residuals do not look serious. Does this have to do with Rotation and Scale too?
- Mark as New
- Bookmark
- Subscribe
- Mute
- Subscribe to RSS Feed
- Permalink
- Report Inappropriate Content
Hi Betty,
Here is a post with more information about rotations on parcels, and how they work.
The lot with a rotation of 359-37-37 is OK, it's just the same as a negative 0°22'23" since 360° is the same as 0°, so 360° minus 0°22'23" = 359°37'37"
With regards to the rejoin and the parcel flying off the screen, I have not been able to reproduce it yet, but does your parcel have long origin connection? What will happen is that if you click the button on the joining dialog that says "Bring joining parcel to map extent" (4th button from the left) the parcel's first point on the origin connection is placed at the center of the map extent. So if you have a long origin connection line, this would place all the other lines off the screen. If you click the button that says "Reset X and Y" (3rd button from the left) this should place the joining geometry back in the correct location.
Would you please contact tech support and go through the steps so that we are able to reproduce it?
Thanks,
-Tim
- Mark as New
- Bookmark
- Subscribe
- Mute
- Subscribe to RSS Feed
- Permalink
- Report Inappropriate Content
Thanks again Tim. I suspected the rotation was as you explained. I tried to find the parcel that was flying away when I went to rejoin it (I had asked about this previously). Since this conversation started I have moved on to another area to test. If I find the suspect parcel, or one like it, I'll make better notes and screen shots and send it to tech support. I'm pretty sure there wasn't a long connector line, although there is an area that had a ridiculous radius...49,220.69' (from a highway r/w so....there ya go) but I can't recall if the suspect parcel was part of that or not. For now...moving on.
I wanted to let you know my successes and how I got there. I found that replacing, not recycling, parcels/descriptions/subdivisions, etc worked best. Initially I thought I could take a parcel, unjoin, re-enter and be good to go. However with the accuracy factor, unless I also include that in my recycling process (all the lines in the grid were of an accuracy of 6), it was slow and had, on occasion, generated unexpected results that were hard to resolve. Since we are trying to update our converted parcels to record, it makes more sense in the long run to delete an area (I don't even unjoin them for safekeeping any longer), take a bite sized area, delete, re-create and join. Then I take the parcels touching the exterior boundary and make them match at least via a join process for now until I can re-create them. This process also helps keep our live parcels intact until we're through with the working maptile. I liken all of this to playing chess, not checkers 
It took two more areas after the first before I came to this conclusion. I was able to get through an area in a week (approx. 89 Lots/Units, 75 Tax Parcels (which most are Duplicated or merged from Lots) and 6 Subs) and get into the Adjustment portion (unfortunately I have a bad section corner so I couldn't get to a final adjustment but at least I could identify my problem areas and fix what I could). I considered this a success. The previous 2 areas took much longer.
Also, using the Parcel Fabric Control toolbar is helpful in identifying problem areas as well as having the ability to recalculate lines (distance and direction) without record.
If this sounds like a ridiculously long, laborious process and there's a better way, I'm open. In the meantime I think our plan will be along this route I've described and we'll keep on keeping on while processing our normal workload too.
It'll be a beautiful thing when the next generation of mappers come aboard! <?!?> 
Thanks Tim! You've been a great help!
~betty