- Home
- :
- All Communities
- :
- Products
- :
- Mapping
- :
- Mapping Questions
- :
- Showing the values in grids
- Subscribe to RSS Feed
- Mark Topic as New
- Mark Topic as Read
- Float this Topic for Current User
- Bookmark
- Subscribe
- Mute
- Printer Friendly Page
Showing the values in grids
- Mark as New
- Bookmark
- Subscribe
- Mute
- Subscribe to RSS Feed
- Permalink
- Report Inappropriate Content
Hi everyone,
I have my Rainfall data on points as shown in the following diagram.

I want them to be show in 3km X 3km grids as shown the following diagram.

I also want the values in these grids as shown in the above, (ie - in regular interval like 0-10, 10-20 ) and the area percentage of these values.
Can you please say me what tool I have to use and how to use them.
Any help is highly appreciable.
- Mark as New
- Bookmark
- Subscribe
- Mute
- Subscribe to RSS Feed
- Permalink
- Report Inappropriate Content
if you have an advanced license, you can do a direct conversion specifying the cell size the same as your interpoint spacing using Point to Raster—Help | ArcGIS for Desktop
if not, you can use Create Fishnet—Help | ArcGIS for Desktop to create square polygons centered about your points, then spatially join the points to the polygon to bring your attributes over.
The classes and symbology, just use standard tools as covered in the help topics
The clipping is the same, but with the raster, you may want to mask out the exterior area to blend in with the background if you choose.
- Mark as New
- Bookmark
- Subscribe
- Mute
- Subscribe to RSS Feed
- Permalink
- Report Inappropriate Content
Hi Patterson
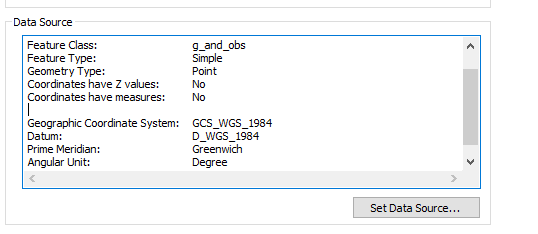
Thank you for your quick reply. I was able to use the Point to Raster tool. But the out put comes as either 3.40282e+038 or -3.40282e+038. Even though the output layer is shown under the table of content I'm unable to see anything in the work-space. I think there are some problem with the units. But I dont know how to correct it. Can you please help me.
Also if I want the output in 3km X 3km grids whats the value I should give in output cell size field ? I mean do they have to be given in meters as 3000?
- Mark as New
- Bookmark
- Subscribe
- Mute
- Subscribe to RSS Feed
- Permalink
- Report Inappropriate Content
Following is the data source of my input file to Point to raster tool
- Mark as New
- Bookmark
- Subscribe
- Mute
- Subscribe to RSS Feed
- Permalink
- Report Inappropriate Content
go the symbology tab for the raster, look at its histogram... what you are seeing is a stretched range... change the symbology so it isn't stretched and do a manual classification to make it look correct.
- Mark as New
- Bookmark
- Subscribe
- Mute
- Subscribe to RSS Feed
- Permalink
- Report Inappropriate Content
Following is my symbology and its not changing from streched to others.
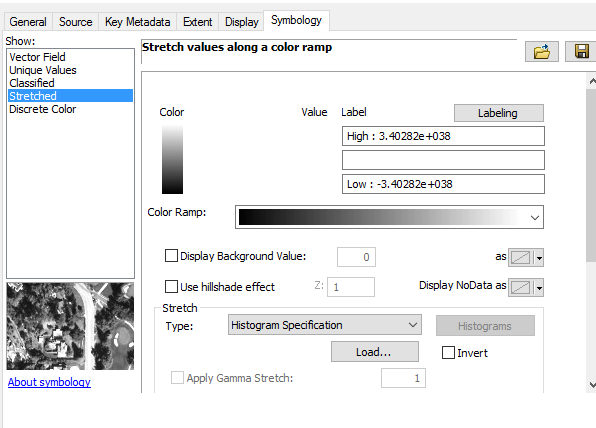
If I try to change it to classified it says following message and if I give ok to it, its not changing and again in stretched.
- Mark as New
- Bookmark
- Subscribe
- Mute
- Subscribe to RSS Feed
- Permalink
- Report Inappropriate Content
Hi
Without giving any processing extent I now gave the cell size as 0.05 and I'm getting nice grids and can change symbology. What is the problem for this behavior and what is my cell size for the value 0.05?
- Mark as New
- Bookmark
- Subscribe
- Mute
- Subscribe to RSS Feed
- Permalink
- Report Inappropriate Content
because your cell size is 0.05 degrees.
when check the symbology, go to the Histogram option to see the real data distribution, never rely on the legend or what the symbology shows to figure out what data values you actually have.
stretched is pretty well useless, unless you know what you are stretching
- Mark as New
- Bookmark
- Subscribe
- Mute
- Subscribe to RSS Feed
- Permalink
- Report Inappropriate Content
Thank you Patterson
But i don't want the grids in degrees. I want it in 5km x 5km grids. How can I do it?
- Mark as New
- Bookmark
- Subscribe
- Mute
- Subscribe to RSS Feed
- Permalink
- Report Inappropriate Content
You seem to have missed my previous response...
you want a projected raster, you could do the projection first using the Project tool
Alternately you can use the Project Raste tool on the raster.
My preference would be the first option
The links are in the actual post. Decide what format you want first (ie projection cell size etc) then worry about symbology... it is the least of your worries... I prefer first name as well