Public Safety Blog

cancel
Showing results for 
Show  only  | Search instead for 
Did you mean: 

Other Boards in This Place


Latest Activity

(65 Posts)
by Anonymous User
Not applicable

By Mike King, Director of Emergency Communications – Esri

Twitter @printcop

In July of this year, public safety professionals from around the world descended on San Diego, California to attend Esri’s 4-day National Security and Public Safety Summit. Over 700 commanders and staff came together to share the challenges and successes they’ve had while protecting over the past year.
 
As the conference began, I stood in awe, hand over heart, as the flag of the United States was presented. I listened intently as our national anthem was powerfully sung.  I felt a sense of gratitude at the reverence displayed by our many international colleagues and government leaders in attendance.
 
During a “moment of silence” for those who had lost their lives in the line of duty last year, my mind raced back to personal friends who died in the line of duty. Their deaths and the accompanying heartache felt by comrades and loved ones suddenly raced back and I found myself stirred with deep emotion. I could see the faces of many of the attendees, and they too seemed to be humbly honoring those great heroes from around the world.
 
Once the summit was underway, I saw police officers, firefighters and emergency managers sitting side-by-side, interacting with each other, both during and in-between sessions. Their common mission of public protection powerfully eliminated preconceived misconceptions and personal biases. Together, they were learning from each other, embracing commonalities and solving problems.
 
I marveled at the great work being done globally, like the work of the Lebanese Red Cross who adopted a new GIS strategy to improve ambulance response times.  These efforts are now saving lives and our colleagues in Lebanon are leveraging that investment to improve their mobile web applications for improved data collection and information sharing.

Lebanese RedCross at Esri
 
The summit provided examples of real-world, national security and public safety challenges, like those shared by CEO Brian Fontes of NENA, the National Emergency Number Association. Fontes shared NENA’s newly created national PSAP Registry portal, designed to spatially show all public safety answering points (command & control centers). The Registry will support many of the next generation call-taking efforts.

CEO Brian Fontes of NENA at Esri


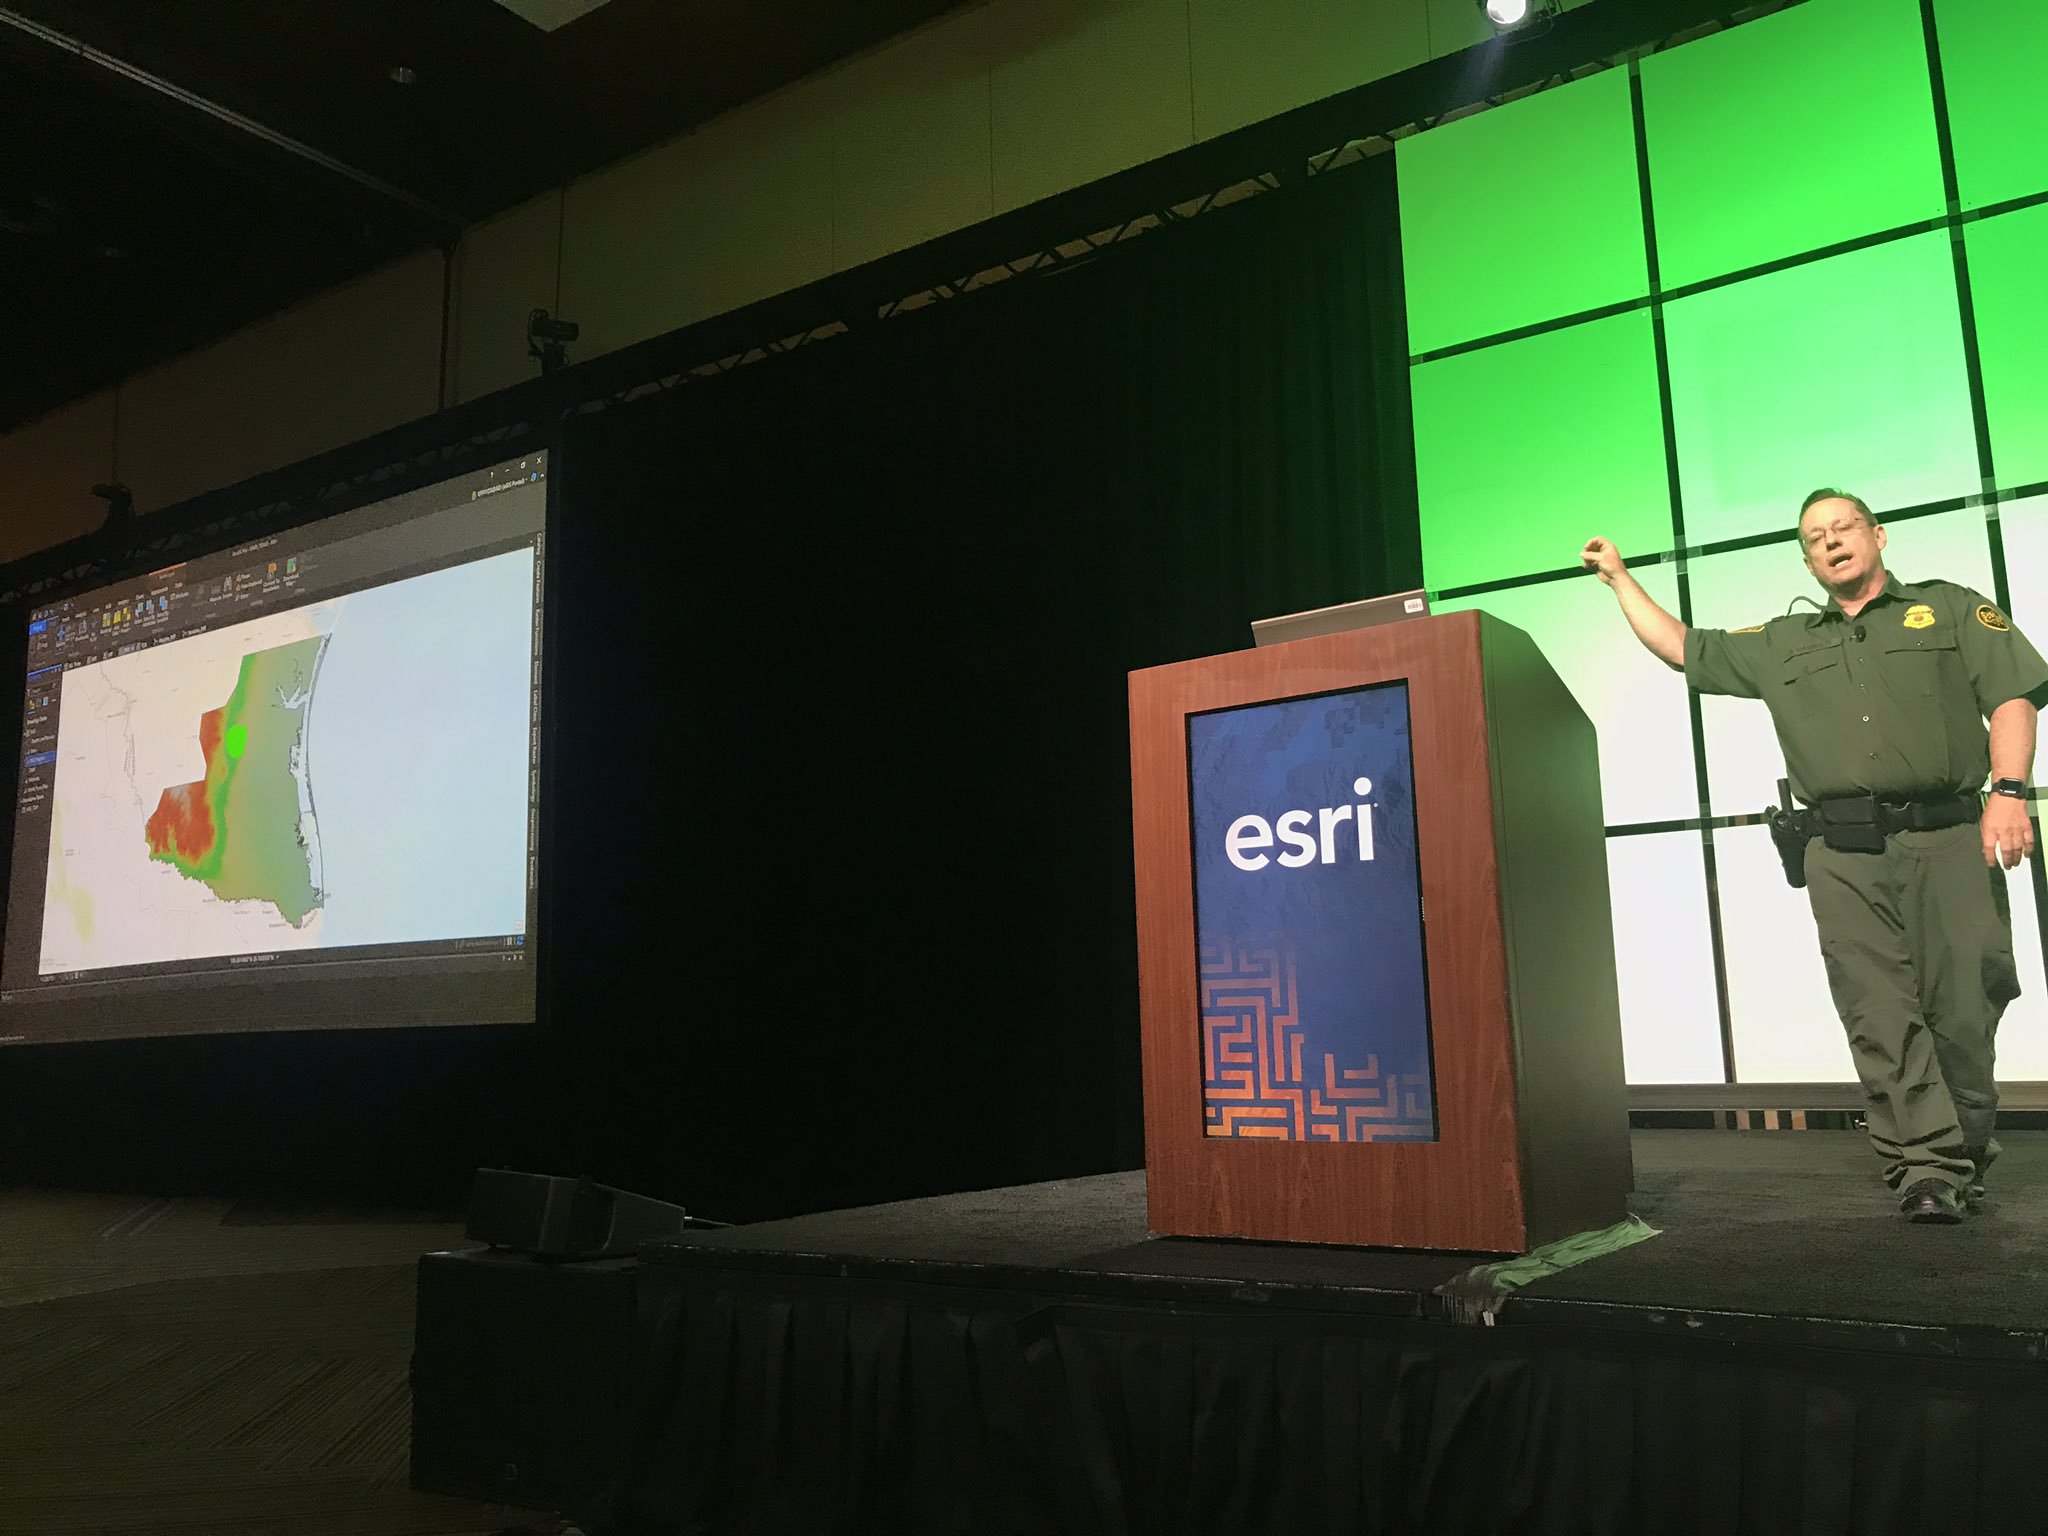
Other presentations included how U.S. Customs and Border Protection is saving lives through the Missing Migrant Program. This program was designed to save lives along the 4,200 square miles of the Rio Grande Valley and evidence shows that it’s working. 

US Border Patrol

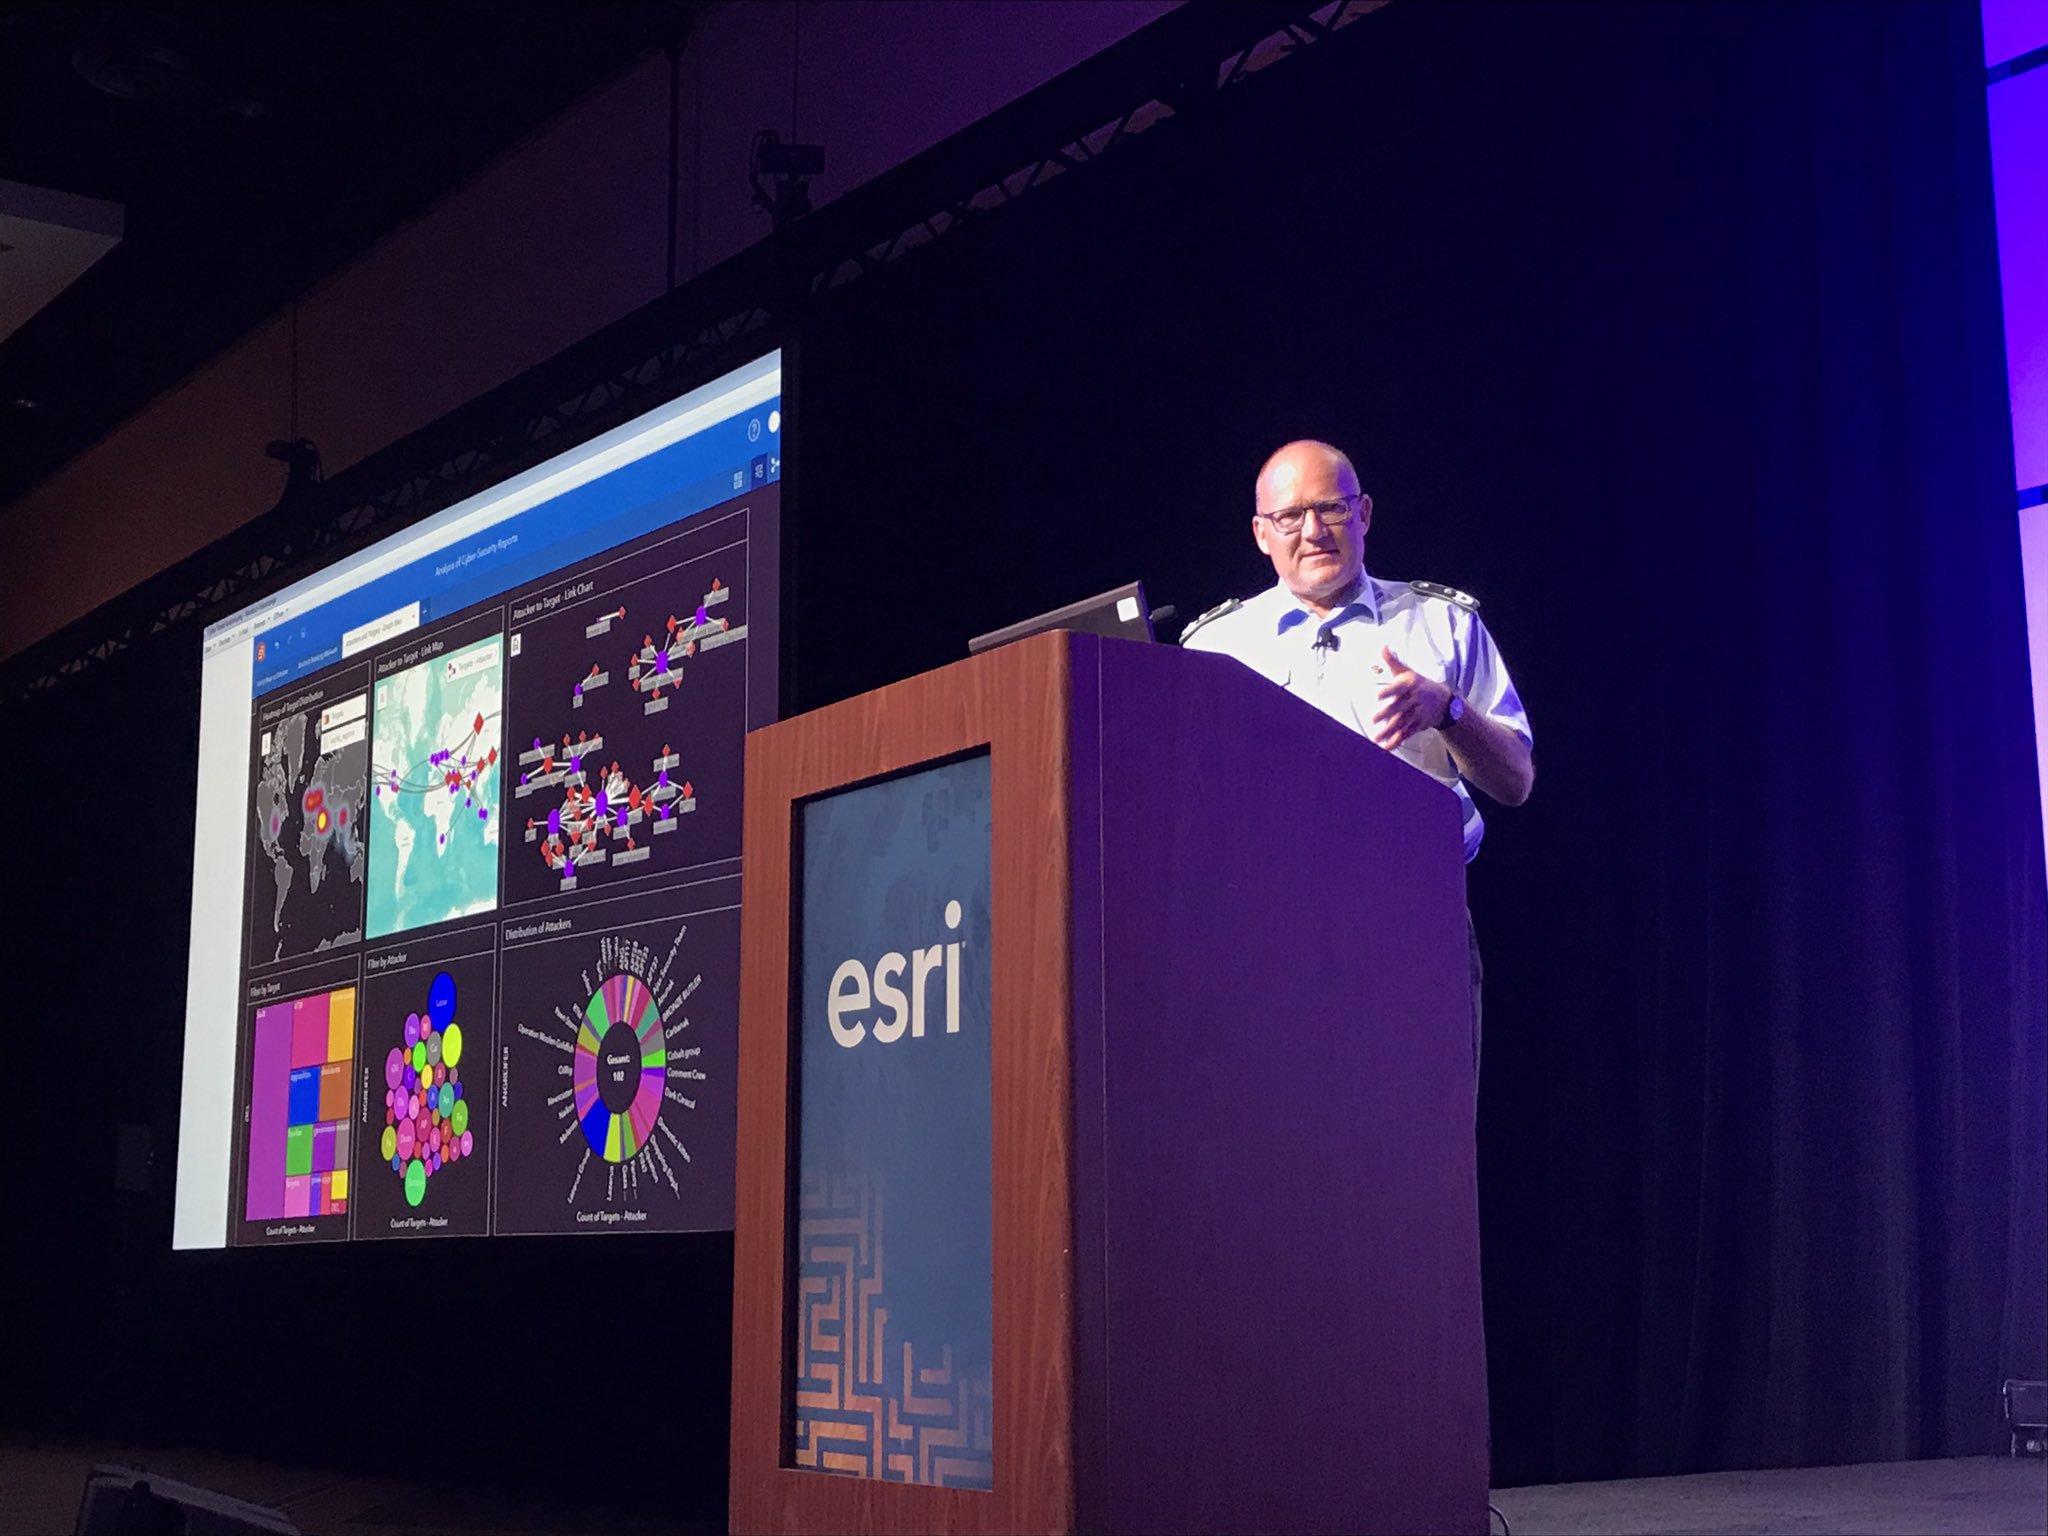
Richard Reed of the FirstNet Authority shared how GIS is used in the rollout of the
first voice and data broadband network dedicated to first-responders and Colonel Volker Kozok showed how the German Armed Forces are using GIS to combat hybrid warfare.
German Armed Forces

 
At one point, I found myself smiling as I reflected on what I was witnessing. It was a true “coming together” of several life-saving disciplines and it included all of the fun-loving banter that exists between first-responders.

 
My personal example goes like this (and sounds like a broken record) as several old firefighter friends approached me with the same humor I’ve heard for 40 years, saying, “Hey King, if you could have scored two more points on your public safety exam, you could have been a fireman too!”  Not to be outdone, and in true form to my law enforcement brotherhood, I simply responded with some of the many reasons why law enforcement is a more noble career, and why we always won the town celebration tug-o’-wars – not just by brawn… but also our brilliance!

Mike King and John Beck at Esri
 
The National Security and Public Safety Summit offered everyone in attendance with a unique balance between visionary leader keynotes, forward-thinking presentations and networking opportunities where attendees could learn about the rapid advances that are occurring globally, including how GIS is influencing and empowering first-responders. Let's continue the conversation in this GeoNet discussion, h
ow will you work to build resilience and collaborate in the new normal?


We want to thank our generous sponsors of the summit which include our gold sponsors: GeoComm, Juvare, Microsoft, and RapidDeploy; and our silver sponsors: BCS, FirstNet, HERE Technologies, and IBM.  If you missed this year’s summit, we will release the proceedings in the coming weeks. Please plan to join us next year at the National Security and Public Safety Summit on July 11-14, 2020 in San Diego. Those registered can also attend the first two days of the Esri International User Conference where more than 19,000 professionals from around the world come together. 


more
0 0 1,767
BrendaMartinez
Esri Regular Contributor

FEMA has combined a number of applications that are part of the FEMA GeoPlatform to create the Hurricane Incident Journal. This story map provides relevant and up-to-date data and tools that provide spatial decision-making support to FEMA leadership. The journal is available to the general public to provide a greater understanding of storm events and a view into the federal information that comes together to inform disaster response.


Included in the Hurricane Incident Journal are:

  • Hurricane Dashboard for Surge Inundation – presents a dashboard view that details the population exposed to surge inundation
  • Hurricane Force Winds Dashboard – analysis of population within the wind threshold
  • Logistics Needs for Surge Inundation – an estimation of the resources needed to support the populations exposed to storm surge
  • Call Volume – an estimation of the number of callers and translator requirement based on surge inundation
  • Hazard Exposure – a model of community impacts weighted by forecasted flood depth, wind speed, and social vulnerability
  • Flood Extents – a hydrodynamic model that simulates flooding based on the Pacific Northwest National Laboratory RIFT model
  • Infrastructure – an interactive map to view the impacts on essential facilities (hospitals, schools, senior centers, etc.) based on wind speeds
  • Transportation –traffic reports from Waze updated every two minutes with Hurricane Evacuation Routes and fuel availability
  • Federal Support Disaster Declaration – a dashboard that shows the counties that have requested federal disaster response


In addition to the individual applications, the Hurricane Incident Journal contains dialogue about each map and links to further resources. The modeled damage assessments are based on flood depth grids and verified using satellite imagery. Wind data comes from the National Oceanic and Atmospheric Administration (NOAA). Satellite imagery and other remote sensing inputs are from NASA and the European Union’s Copernicus program. Weather data comes from the National Weather Service. Flooding models are informed by stream gauge sensor data feeds from the US Geological Survey. Additionally, these applications draw on data from joint field offices, disaster recovery centers, shelters, and other sources.


Esri’s geospatial cloud platform, ArcGIS , provides the means to deliver these lightweight applications. These dashboards and interactive maps incorporate an array of inputs to provide a quickly understandable common operational picture—condensing the time between data and decisions.

For more information on active hurricane response, please visit the Esri Disaster Response Program at www.esri.com/disaster


more
1 0 1,226
BrendaMartinez
Esri Regular Contributor

A new interactive story map provides a place to share photos from the 2018 hurricane season. People can quickly post photos of preparations and the impacts from this year’s storms. The photos appear on a map alongside projected storm paths, providing an on-the-ground perspective of these events as they unfold. Visitors to the map can zoom in to see the photos related to specific areas or can browse through all the images to get a broad overview of storms.


The story map is the work of the National Alliance for Public Safety GIS (NAPSG) and GIS Corps. NAPSG has compiled a number of helpful resources for GIS practitioners who are preparing for these events. GIS Corps volunteers are poised to assist communities by applying GIS skills to aid recovery efforts.


The app is designed to engage those on the ground in these areas as well as those bearing witness from afar. Participants are encouraged to upload images from social media channels that contain an identified location. The images and map provide a compelling interface to gain a greater understanding of 2018 hurricane damage at the ground level.

This map can also be found in the public apps gallery for the Esri Disaster Response Program - monitoring events 24/7 and here when you need it most. If your capacity has been exceeded and you need geospatial support, Request Assistance online today.

more
1 0 1,467
BrendaMartinez
Esri Regular Contributor

Hurricane Harvey, at one point a category 4 hurricane, has brought devastating amounts of rainfall with extensive damages to Texas and Louisiana. As Harvey continues its catastrophic path, Esri’s Disaster Response Program (DRP) is here to support you around the clock 24/7.


If you need support with additional software, data, or technical support you can request immediate assistance from the DRP.

The Hurricanes and Tropical Cyclones Overview map provides up to date information on the potential impact, precipitation, and path of Harvey.


Emergency management agencies are also using social media and crowd sourcing to gain insight on the situation. This Crowdsource Story Map helps responders and emergency managers gain insight into the situation on the ground.


The Tropical Strom Harvey: Current Conditions Application

This interactive web application features Hurricane Harvey tracking, traffic alerts, road closures, shelter locations, flood gauges and more.

Track and forecast the path of Harvey:

Stay up to date with traffic alerts and closures:

Locate a shelter location nearest you:

Analyze the current situation of flood gauges:

Analyze 72-hour precipitation forecast:

Follow the DRP on Twitter and Facebook for the latest news.

more
3 0 4,269
71 Subscribers