- Home
- :
- All Communities
- :
- Industries
- :
- Transportation
- :
- Public Transit
- :
- Public Transit Questions
- :
- Calculate Accessibility Matrix Inconsistent Result...
- Subscribe to RSS Feed
- Mark Topic as New
- Mark Topic as Read
- Float this Topic for Current User
- Bookmark
- Subscribe
- Mute
- Printer Friendly Page
Calculate Accessibility Matrix Inconsistent Results
- Mark as New
- Bookmark
- Subscribe
- Mute
- Subscribe to RSS Feed
- Permalink
- Report Inappropriate Content
Hello,
I am having an issue with the Calculate Accessibility Matrix tool from the Transit Network Analysis toolset. I ran this script using a selection of Census Blocks as my origins with a larger set of Census Blocks as my Destinations. I followed the same workflow as shown here: https://www.youtube.com/watch?v=FAmaK1fVpyY which was created by ESRI. Out of the 5,875 Census Blocks ran as origins, 3,784 blocks were given a TotalDest value of 0. Additionally there are many incidences of Census Blocks being located next to each other with one having over 10,000 destinations and the ones surrounding it having 0. With this being a major metropolitan area the results are especially puzzling. Any help or insight would be greatly appreciated. This is my first post on an ESRI forum, apologies if anything was done incorrectly.
Solved! Go to Solution.
Accepted Solutions
- Mark as New
- Bookmark
- Subscribe
- Mute
- Subscribe to RSS Feed
- Permalink
- Report Inappropriate Content
Okay, I figured it out, and I have a fix for you. It was a bug in my code.
The code was assuming that the origins always use a field called "ObjectID" as the ObjectID field, but your data was using "ObjectID_1" for whatever reason. This situation arises when you do joins or various other operations that combine multiple tables. It's nothing you did wrong, just a situation I neglected to account for.
It was a simple fix, and the updated tool is available either from ArcGIS Online or GitHub.
- Mark as New
- Bookmark
- Subscribe
- Mute
- Subscribe to RSS Feed
- Permalink
- Report Inappropriate Content
Hello Joseph. Yes, I agree that these results don't look correct.
My first thought is that something is wrong with your network dataset. Possibly the connectivity of the street features is incorrect. Maybe you need to switch from End Point to Any Vertex.
Have you done any testing of this transit network using an ordinary Service Area or Route, just to see if the results are sensible? OD Cost Matrix is a bit more abstract, making it hard to see what's really happening. The Calculate Accessibility Matrix tool is even more abstract.
- Mark as New
- Bookmark
- Subscribe
- Mute
- Subscribe to RSS Feed
- Permalink
- Report Inappropriate Content
Hi Melinda, thank you for your expedient response! An especially perplexing element to this is that I took a sampling of Census Blocks that were given a TotalDest value of 0 and ran a Service Area analysis on these points and got an output of expected results which would include thousands of destinations had it been run through Calculate Accessibility Matrix. I also tried running this sampling through Calculate Accessibility Matrix again by itself and still got TotalDest values of 0. I will try your suggestion of changing the streets feature in my network from End Point to Any Vertex and see if this works. The tool takes about 8.5 hrs to run so I will report back the results later.
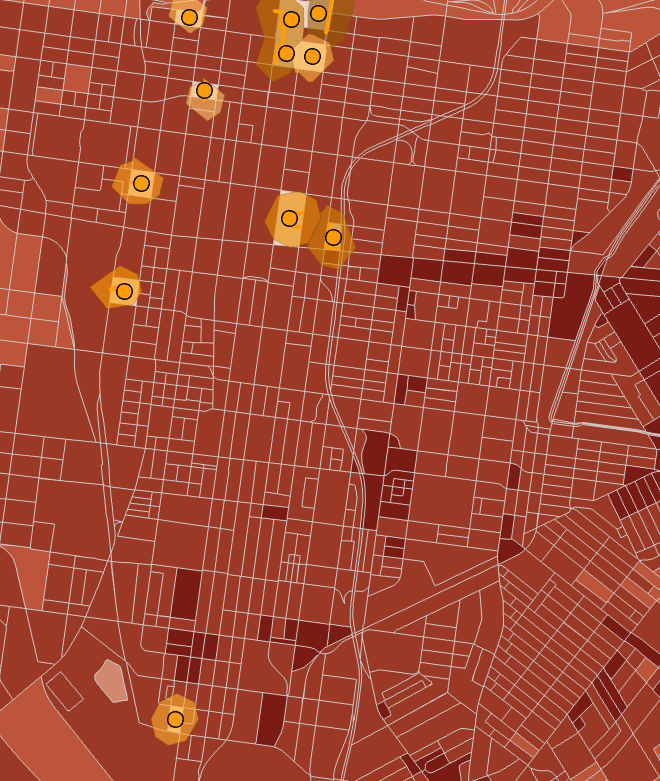
The attached image shows 22 points that Calculate Accessibility Matrix gave a TotalDest value of zero, ran through Service Area which shows a large area that does not indicate zero total destinations.
- Mark as New
- Bookmark
- Subscribe
- Mute
- Subscribe to RSS Feed
- Permalink
- Report Inappropriate Content
Well, if the Service Area results look sensible (and the screenshot results look okay to me), then the problem is not likely with your network dataset. Don't change the connectivity from End Point to Any Vertex blindly without understanding why. That change is intended for specific situations when your streets extend for several blocks and have vertices at intersections instead of being broken up into separate features.
- Mark as New
- Bookmark
- Subscribe
- Mute
- Subscribe to RSS Feed
- Permalink
- Report Inappropriate Content
If you're able to share your data (network dataset as well as origin and destination points), I would be happy to take a look at it. It's always possible there is a bug in the Calculate Accessibility Matrix tool, or maybe I could easily identify the problem with the network.
- Mark as New
- Bookmark
- Subscribe
- Mute
- Subscribe to RSS Feed
- Permalink
- Report Inappropriate Content
Thank you so much for offering to take a look at this, I uploaded a zipped file geodatabase here: https://arcg.is/u1P8j0 that should have all necessary data as well as a readme file.
- Mark as New
- Bookmark
- Subscribe
- Mute
- Subscribe to RSS Feed
- Permalink
- Report Inappropriate Content
Your network dataset looks fine. I'm still trying to figure out what's going on.
What version of ArcGIS Pro are you using? The tool behaves slightly differently depending on the version.
- Mark as New
- Bookmark
- Subscribe
- Mute
- Subscribe to RSS Feed
- Permalink
- Report Inappropriate Content
I am using ArcGIS 2.9.2
- Mark as New
- Bookmark
- Subscribe
- Mute
- Subscribe to RSS Feed
- Permalink
- Report Inappropriate Content
Okay, I figured it out, and I have a fix for you. It was a bug in my code.
The code was assuming that the origins always use a field called "ObjectID" as the ObjectID field, but your data was using "ObjectID_1" for whatever reason. This situation arises when you do joins or various other operations that combine multiple tables. It's nothing you did wrong, just a situation I neglected to account for.
It was a simple fix, and the updated tool is available either from ArcGIS Online or GitHub.
- Mark as New
- Bookmark
- Subscribe
- Mute
- Subscribe to RSS Feed
- Permalink
- Report Inappropriate Content
Thanks so much for your help with this, the results look much more like they ought to. A few census blocks remain outliers but I believe this is due to some kind of bad connectivity in the network. I've attached some images just in case because I am still learning to use network analyst.
It appears that for the outlying census blocks, if I run Service Area analysis, the results are in line with Calculate Accessibility Matrix, and you can see that the connectivity is limited when lines are displayed. If I change the streets layer in the Network Dataset to "any vertex" more of the census blocks have expected outputs (but not all, these have been selected in blue).
If there is any suggestion you might have on how to adjust, repair or account for these weird phenomena in the network it would be greatly appreciated. I will mark your last post as the solution though --- as I believe for anyone else experiencing an issue like mine, your bug fix will likely fix their issue. Again, thank you so much!