- Subscribe to RSS Feed
- Mark as New
- Mark as Read
- Bookmark
- Subscribe
- Printer Friendly Page
- Report Inappropriate Content
Free Frequency...
Backtrack 2019-07-23 ***Advanced license still required for Frequency in ArcGIS Pro***
Announced 2017-04-15 ***Frequency is freed... version for ArcGIS Pro
Created 2016-03-02
Modified 2016-12-20 *** the shackles remain in 10.5 make it your resolution in 2017 to join the cause
References many
Why is this tool only available at the Advanced license level???
Come on. That is lame. This type of question comes up time and again.
Select your options from the following request.
------------------------------
I have ...
- two - several - many
columns containing class information with
- the same - different data types
and I want to combine them to produce a unique classification scheme and
- count the number in each class
- calculate some statistical value,
- graph it.
------------------------------
Get the picture? Sound familiar?
I will show the results of doing this type of analysis and provide an attachment for you to do it.
In ArcGIS, the Frequency tool produces these results
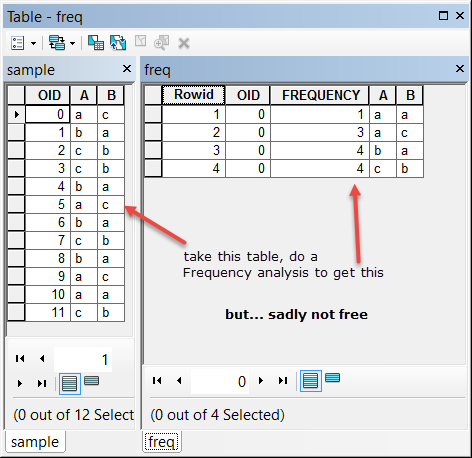
Now these results look similar...in fact identical, but created without using the frequency tool... but using tools provided within ArcMap itself.
| Input array | Sorted array | Summary |
|---|---|---|
A B 'a', 'c' 'b', 'a' 'c', 'b' 'c', 'b' 'b', 'a' 'a', 'c' 'b', 'a' 'c', 'b' 'b', 'a' 'a', 'c' 'a', 'a' 'c', 'b' | A B class row 'a', 'a' 0 0 'a', 'c' 1 1 'a', 'c' 1 'a', 'c' 1 'b', 'a' 2 4 'b', 'a' 2 'b', 'a' 2 'b', 'a' 2 'c', 'b' 3 8 'c', 'b' 3 'c', 'b' 3 'c', 'b' 3 | combinations class ( 'a', 'a' ) 0 ( 'a', 'c' ) 1 ( 'b', 'a' ) 2 ( 'c', 'b' ) 3 first occurence 0, 1, 4, 8 reclassed list 0 1 1 1 2 2 2 2 3 3 3 3 class 0 1 2 3 4 count 1 3 4 4 - |
Now to produce the results above, you could
- build an SQL style query using the unique combinations of inputs for each field (ie if A =='a' and B == 'a': then...)
- concatenate the values in each field (accounting for differences in data types), get the unique combinations
These can be determined using:
- built in tools in arcmap ( field calculator, the Calculate Field, Frequency and Summarize tools).
- scripting, using python with searchcursors or arcobjects. You could even make a fancy interface to collect and present the results.
You can even produce graphs.
So... how was it done? ... it is in the attachment.
Join the cause... frequently used tools should be part of the standard arsenal.
You must be a registered user to add a comment. If you've already registered, sign in. Otherwise, register and sign in.