- Home
- :
- All Communities
- :
- Developers
- :
- Python
- :
- Python Questions
- :
- Find values and Interpolate recurrence Interval
- Subscribe to RSS Feed
- Mark Topic as New
- Mark Topic as Read
- Float this Topic for Current User
- Bookmark
- Subscribe
- Mute
- Printer Friendly Page
Find values and Interpolate recurrence Interval
- Mark as New
- Bookmark
- Subscribe
- Mute
- Subscribe to RSS Feed
- Permalink
- Report Inappropriate Content
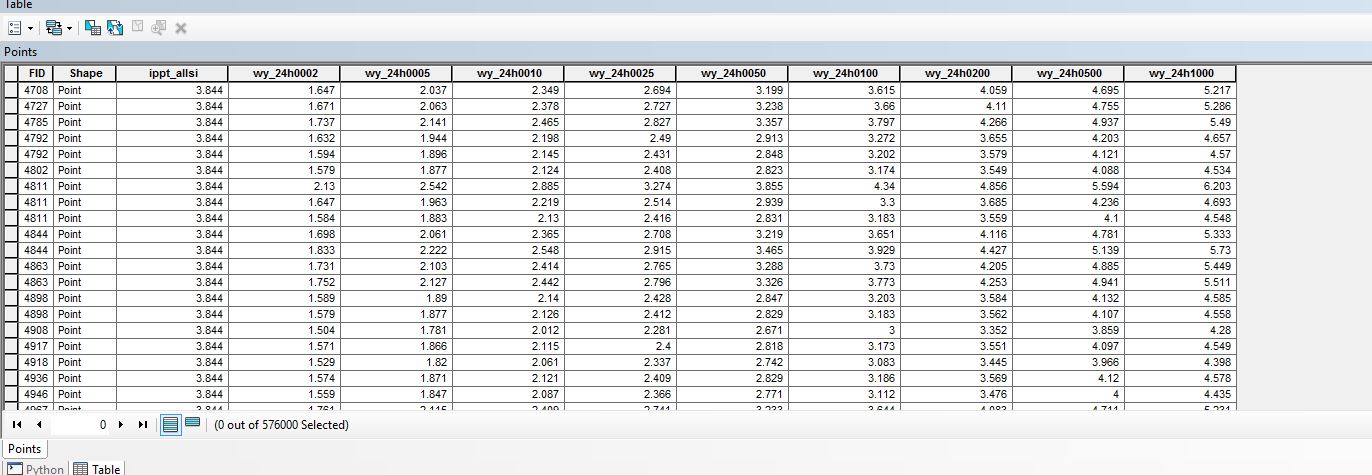
In the table on the Image below, ippt_allsi represents precipitation amounts for a given storm. The rest of the fields represent the precipitation amounts for that number of years recurrence intervals. 2, 5,10, 25, 50 and so on. I need a script that will take the precipitation amount for the storm, (appt_allsi) then find the bounding larger and smaller values and interpolate the recurrence year by where the precipitation amount falls between those years values. For instance, for the first record, 3.84 inches of rain fell. The 100 year amount is 3.615 and the 200 year amount is 4.059. How would I return the interpolated recurrence year for the 3.84 inches? I am fairly new to python and am struggling. Could somebody please get me started in the right direction?
Solved! Go to Solution.
Accepted Solutions
- Mark as New
- Bookmark
- Subscribe
- Mute
- Subscribe to RSS Feed
- Permalink
- Report Inappropriate Content
Verbose demo with constructed featureclass... only 5 records, number isn't relevent, can create output directly.
# coding: utf-8
"""
Script:  interpolate_demo.py
Author:  Dan.Patterson@carleton.ca
Purpose: To demonstrate interpolation using values in ndarrays

field names constructed using the following to simplify dt
  dt_names = ["v"+str(i) for i in range(N)]
  dt = [(dt_names, "<f8") for i in range(N)]
Array should be constructed using arcpy.da.FeaturelassToNumPyArray
RI - time relationships are on a row by row basis, could be greatly
simplified if there were fewer, but not needed

"""
import numpy as np
np.set_printoptions(edgeitems=3,linewidth=80,precision=2,suppress=True,
                    threshold=20, formatter={'float': '{: 0.3f}'.format})

# fix dtype
dt = [('OIDName', '<i4'), ('Shape', '<f8', (2,)), ('obs', '<f8'),
      ('v0', '<f8'), ('v1', '<f8'), ('v2', '<f8'), ('v3', '<f8'),
      ('v4', '<f8'), ('v5', '<f8'), ('v6', '<f8'), ('v7', '<f8')]
a = np.array([(0, [0,0],  7.5, 1, 3, 5, 10, 20, 50, 100, 200),
              (1, [1,2], 15.0, 1, 3, 5, 10, 20, 50, 100, 200),
              (2, [3,4], 75.0, 1, 3, 5, 10, 20, 50, 100, 200),
              (3, [5,6], 35.0, 2, 4, 6, 11, 25, 50, 140, 225),
              (4, [7,8],  9.0, 3, 5, 7, 10, 22, 40, 120, 230)], dtype=dt)
# ---- It begins below
t = [5,10,20,50,100,200,500,1000]  # fixed time increments
obs = a["obs"]                    # we know the name so use it
ri_names = list(a.dtype.names[3:]) # could type in a long list
RI_s = a[ri_names]                # RI curve values
N = len(obs)                      # number of records
# -- the magic of list comprehensions, could vectorize, but hey...
result = [ (a["OIDName"], a["Shape"].tolist(), obs,
            np.interp(obs, RI_s.tolist(), t) )
            for i in range(N)]
dt_out =  [('OIDName', '<i4'), ('Shape', '<f8', (2,)),
          ('obs', '<f8'),  ('RI_2', '<f8')]
out_array = np.array(result, dtype=dt_out)
# Could send out_array to a featureclass using NumPyArrayToFeatureClass
#---- The rest is fluff
print("\nInput ndarray \n{}\ndtype {}\nShape {}\n".format(a, a.dtype, a.shape))
print("\nViewed differently\n{}".format(a.reshape((-1,1))))
print("\nResults...\nTimes {}\n{}".format(t,out_array.reshape((-1,1))))
#
Outputs
Input ndarray
[(0, [0.0, 0.0], 7.5, 1.0, 3.0, 5.0, 10.0, 20.0, 50.0, 100.0, 200.0)
 (1, [1.0, 2.0], 15.0, 1.0, 3.0, 5.0, 10.0, 20.0, 50.0, 100.0, 200.0)
 (2, [3.0, 4.0], 75.0, 1.0, 3.0, 5.0, 10.0, 20.0, 50.0, 100.0, 200.0)
 (3, [5.0, 6.0], 35.0, 2.0, 4.0, 6.0, 11.0, 25.0, 50.0, 140.0, 225.0)
 (4, [7.0, 8.0], 9.0, 3.0, 5.0, 7.0, 10.0, 22.0, 40.0, 120.0, 230.0)]
dtype [('OIDName', '<i4'), ('Shape', '<f8', (2,)), ('obs', '<f8'),
           ('v0', '<f8'), ('v1', '<f8'), ('v2', '<f8'), ('v3', '<f8'), ('v4', '<f8'),
          ('v5', '<f8'), ('v6', '<f8'), ('v7', '<f8')]
Shape (5,)

Viewed differently
[[(0, [0.0, 0.0], 7.5, 1.0, 3.0, 5.0, 10.0, 20.0, 50.0, 100.0, 200.0)]
 [(1, [1.0, 2.0], 15.0, 1.0, 3.0, 5.0, 10.0, 20.0, 50.0, 100.0, 200.0)]
 [(2, [3.0, 4.0], 75.0, 1.0, 3.0, 5.0, 10.0, 20.0, 50.0, 100.0, 200.0)]
 [(3, [5.0, 6.0], 35.0, 2.0, 4.0, 6.0, 11.0, 25.0, 50.0, 140.0, 225.0)]
 [(4, [7.0, 8.0], 9.0, 3.0, 5.0, 7.0, 10.0, 22.0, 40.0, 120.0, 230.0)]]

Results...
Times [5, 10, 20, 50, 100, 200, 500, 1000]
[[(0, [0.0, 0.0], 7.5, 35.0)]
 [(1, [1.0, 2.0], 15.0, 75.0)]
 [(2, [3.0, 4.0], 75.0, 350.0)]
 [(3, [5.0, 6.0], 35.0, 140.0)]
 [(4, [7.0, 8.0], 9.0, 40.0)]]
Values against average RI data
# averages
RI_avg = np.mean(RI_s.tolist(),axis=0)
t = [5,10,20,50,100,200,500,1000]  # fixed time increments as before
obs = a["obs"]   # as before
result2 = np.interp(obs, RI_avg.tolist(), t)
>>> result2
array([ 32.391, 71.429, 326.562, 151.128, 42.174])
Plus other combinations if needed
- Mark as New
- Bookmark
- Subscribe
- Mute
- Subscribe to RSS Feed
- Permalink
- Report Inappropriate Content
The whole process can be vectorized using numpy. A simple example using a 1D interpolation for the years spanning the data value are show in the following. You can get your table out to a numpy array using TableToNumPyArray or FeatureClassToNumPy array and do you processing in python.
Perhaps this is for a later stage in you python progress, but keep it in mind for the future (ps... the decimal points are useless and should have been enclosed in int(val)
>>> import numpy as np
>>> t = [100,200]
>>> v = [3.615,4.059]
>>> np.interp(3.85,v,t)
152.9279279279279
- Mark as New
- Bookmark
- Subscribe
- Mute
- Subscribe to RSS Feed
- Permalink
- Report Inappropriate Content
Thank you so much! I am still a little confused on how to find the bounding precipitation values and years and assign them to the variables for all of the 500K points.
- Mark as New
- Bookmark
- Subscribe
- Mute
- Subscribe to RSS Feed
- Permalink
- Report Inappropriate Content
As I said, this may be for the future, but here is an example
# coding: utf-8
import numpy as np
t = [5,10,25,50,100,200,500,1000] # fixed time increments
v = [1, 3, 5, 10, 20, 50, 100, 200] # a row in your table of precip
obs = [2, 7, 10]
rec_int = np.interp(obs,v,t)
print("interval ...{}".format(rec_int))
result
interval ...[ 7.5 35. 50. ]
You have a fixed time series (t)
You have values that correspond to t in each row... call this 'v'
You have a value or values that you want to find the recurrence interval for... cal this or these obs. In the example above for that one pairing, we have 3 observations and want to get the interval that they correspond to (again, using a simple interpolation)
the result is 7.5, 35, 50 which looks pretty good.
- Mark as New
- Bookmark
- Subscribe
- Mute
- Subscribe to RSS Feed
- Permalink
- Report Inappropriate Content
Thanks for taking the time yesterday to show me about numpy and arrays. I have created an array of my point feature class. Can you please provide an example syntax of how I would loop through the array and assign the variables to obs and v to do the calculation for rec_int? When I use arr.shape on my array it says I have 378288 records but no rows. Is this ok or will I need to reshape it somehow? I tried a bit but didn't have much luck. I assume then this array can be converted back to points once the Recurrence interval field is calculated? Any help would be greatly appreciated. Thanks and have a great day.
- Mark as New
- Bookmark
- Subscribe
- Mute
- Subscribe to RSS Feed
- Permalink
- Report Inappropriate Content
Since you have field names, then you have a structured array, the array will be in the form:
>>> a0
array([(0, (3000333.24, 5025708.0), ('AAA', 'a'), 10),
       (1, (3000973.78, 5025081.88), ('A', 'aa'), 10),
       (2, (3000941.85, 5025441.88), ('AA', 'b'), 2), ...,
       (7, (3000668.85, 5025916.81), ('B', 'c'), 5),
       (8, (3000735.19, 5025447.1), ('C', 'cc'), 50),
       (9, (3000226.22, 5025511.07), ('B', 'a'), 4)],
      dtype=[('ID', '<i4'), ('Shape', [('X', '<f8'), ('Y', '<f8')]), ('Class', [('Main', 'S5'), ('Sub', 'S5')]), ('Total', '<i4')])
Individual columns are accessed via their name... some examples are included below. In this file there are two nested columns (aka a column within a column) something which can't be done with spreadsheets, but is common when working with featureclasses or shapefiles (ie the Shape field and my Class field). You don't need to worry about these.
>>> a0['ID']
array([0, 1, 2, ..., 7, 8, 9], dtype=int32)
>>> a0['Shape']
array([(3000333.24, 5025708.0), (3000973.78, 5025081.88),
       (3000941.85, 5025441.88), ..., (3000668.85, 5025916.81),
       (3000735.19, 5025447.1), (3000226.22, 5025511.07)],
      dtype=[('X', '<f8'), ('Y', '<f8')])
>>> a0['Shape']['X']
array([ 3000333.240,  3000973.780,  3000941.850, ...,  3000668.850,
        3000735.190,  3000226.220])
>>> a0['Total']
array([10, 10,  2, ...,  5, 50,  4], dtype=int32)
Here is some code that will demonstrate the principles for your situation
# coding: utf-8
import numpy as np
np.set_printoptions(edgeitems=3,linewidth=80,precision=2,suppress=True,threshold=20, formatter={'float': '{: 0.3f}'.format})
#
t = [5,10,25,50,100,200,500,1000] # fixed time increments
v = [1, 3, 5, 10, 20, 50, 100, 200] # a row in your table of precip
#
a = np.array(list(zip(t,v)), dtype=[('Time','int32'),('Val_0','float64')])
print("array \n{}\ndtype {}\nShape {}".format(a, a.dtype, a.shape))
print("viewed differently\n{}".format(a.reshape((-1,1))))
#
obs = [2, 7, 10]
rec_int = np.interp(obs,a['Val_0'],a['Time'])
print("Interpolation results for {}\ninterval ...{}".format(obs,rec_int))
# interval ...[ 7.500  35.000  50.000]
Here are the results of yesterdays example
array
[(5, 1.0) (10, 3.0) (25, 5.0) (50, 10.0) (100, 20.0) (200, 50.0) (500, 100.0)
(1000, 200.0)]
dtype [('Time', '<i4'), ('Val_0', '<f8')]
Shape (8,)
viewed differently
[[(5, 1.0)]
[(10, 3.0)]
[(25, 5.0)]
[(50, 10.0)]
[(100, 20.0)]
[(200, 50.0)]
[(500, 100.0)]
[(1000, 200.0)]]
Interpolation results for [2, 7, 10]
interval ...[ 7.500  35.000  50.000]
The first thing that you may notice is that the column headers are now a column and your rows are now columns. I did this translation while constructing the array. It is a minor detail. But if you want to attach a small text example of your output structure as either a csv file or csv delimited I can work with more specifics. If you are interested in things array, you may wish to consider the NumPy Repository for inclusion in your sites.
- Mark as New
- Bookmark
- Subscribe
- Mute
- Subscribe to RSS Feed
- Permalink
- Report Inappropriate Content
Thanks again. So would I just use an update cursor and for loop as normal to populate the "V" and "obs" variables to feed into the interp command?
- Mark as New
- Bookmark
- Subscribe
- Mute
- Subscribe to RSS Feed
- Permalink
- Report Inappropriate Content
absolutely not!!! that would defeat the purpose of using arrays structures and methods in the first place ... Are you using the same Time, Val relationship for all cases of recurrence intervals? If so, you will notice that I fed 3 numbers into the "curve" and it "interpolated 3 values. If you had 1, you would feed it one.
I will write this verbosely, so you can see what can be done. In this case, I will get RI's for the same 3 numbers, but using 2 different T-Val relationships. I could just as easily use one relationship and determine all the interpolations for any number of inputs. Ergo... that is why I was interested in seeing your data construct so I can show you the easiest way of forumulating the array without having to specify field names and datatype during its construct. But anyway, this will give you an idea... and a lesson 
import numpy as np
np.set_printoptions(edgeitems=3,linewidth=80,precision=2,suppress=True,threshold=20, formatter={'float': '{: 0.3f}'.format})
#
t = [5,10,25,50,100,200,500,1000] # fixed time increments
v = [1, 3, 5, 10, 20, 50, 100, 200] # a row in your table of precip
v1 = [2,4,6,11,25,50,140,225]
#
a = np.array(list(zip(t,v,v1)), dtype=[('Time','int32'),('Val_0','float64'), ('Val_1','float64')])
print("array \n{}\ndtype {}\nShape {}".format(a, a.dtype, a.shape))
print("viewed differently\n{}".format(a.reshape((-1,1))))
#
obs = [2, 7, 10]
rec_int = [ np.interp(obs,a[ i ],a['Time']) for i in ['Val_0','Val_1'] ]
print("Interpolation results for {}\ninterval ...{}".format(obs,rec_int))
array
[(5, 1.0, 2.0) (10, 3.0, 4.0) (25, 5.0, 6.0) (50, 10.0, 11.0) (100, 20.0, 25.0)
(200, 50.0, 50.0) (500, 100.0, 140.0) (1000, 200.0, 225.0)]
dtype [('Time', '<i4'), ('Val_0', '<f8'), ('Val_1', '<f8')]
Shape (8,)
viewed differently
[[(5, 1.0, 2.0)]
[(10, 3.0, 4.0)]
[(25, 5.0, 6.0)]
[(50, 10.0, 11.0)]
[(100, 20.0, 25.0)]
[(200, 50.0, 50.0)]
[(500, 100.0, 140.0)]
[(1000, 200.0, 225.0)]]
Interpolation results for [2, 7, 10]
interval ...[array([ 7.500, 35.000, 50.000]), array([ 5.000, 30.000, 45.000])]And there will be naysayers ... right Darren 
- Mark as New
- Bookmark
- Subscribe
- Mute
- Subscribe to RSS Feed
- Permalink
- Report Inappropriate Content

I get your example when you manually put in the V values. However, the V value and the obs value will need to be dynamic variables. Here is a breakdown of exactly what I am trying to do. If you look at the above Image, its the attribute field of my point feature class. The Precip_Amount is the observed depth. "obs" variable. The next 8 fields are precipitation Frequency depth amounts by year. Each field representing a year amount. 5, 10, 25 and so on. "v" variable. I want to use those and the harcoded "Years" variable to interpolate the ARI field with the recurrence interval. This will have to be done for 370k records with different v and obs values for every record. Then I want to export the points to a raster. Which I know how to do but if I go to an array I need to be able to get back to points.
- Mark as New
- Bookmark
- Subscribe
- Mute
- Subscribe to RSS Feed
- Permalink
- Report Inappropriate Content
row 1, precip 1.18, your field names are the 5,10,25,50,100,200,500,1000 year (aka...Time)
obs
5, 10, 25, 50,100, 200, 500, 1000 Time
1.18 1.977, 2.242, 2.539, 3.001, 3.393, 3.814, 4.424,4.932 Val_1
etc etc val 2 val 3
just export precip amount and over to the left for a dozen or so records into a text file or csv file and/or copy the values here and I will show you. I just don't want to type up a whole example data set. Joining the result back is easy.
So in essence, you have observed precipitation values at a variety of stations. Each station has a time-precip relationship representing the x-year event for that station. You want to determine the what recurrence interval, the observed precipitation values represent for that particular time, given those stations. Should the recurrence intervals (RI) be similar, then the pattern in space is similar as it is in time. Should the spatial pattern of the RI be different for that time, then the precip for that year varied spatially
Another question. Have you examined the means and std's of the values in the time columns to ascertain whether there is a significant difference in them to justify using separate time-event values for each station OR have you already determined that it would be best to use individual curves for each station? There are ... as you probably know reasons for using individual curves and reasons where it may not be necessary.