- Home
- :
- All Communities
- :
- Products
- :
- Spatial Data Science
- :
- Spatial Data Science Questions
- :
- Re: average of ice edge lines (distance from coast...
- Subscribe to RSS Feed
- Mark Topic as New
- Mark Topic as Read
- Float this Topic for Current User
- Bookmark
- Subscribe
- Mute
- Printer Friendly Page
average of ice edge lines (distance from coast)
- Mark as New
- Bookmark
- Subscribe
- Mute
- Subscribe to RSS Feed
- Permalink
- Report Inappropriate Content
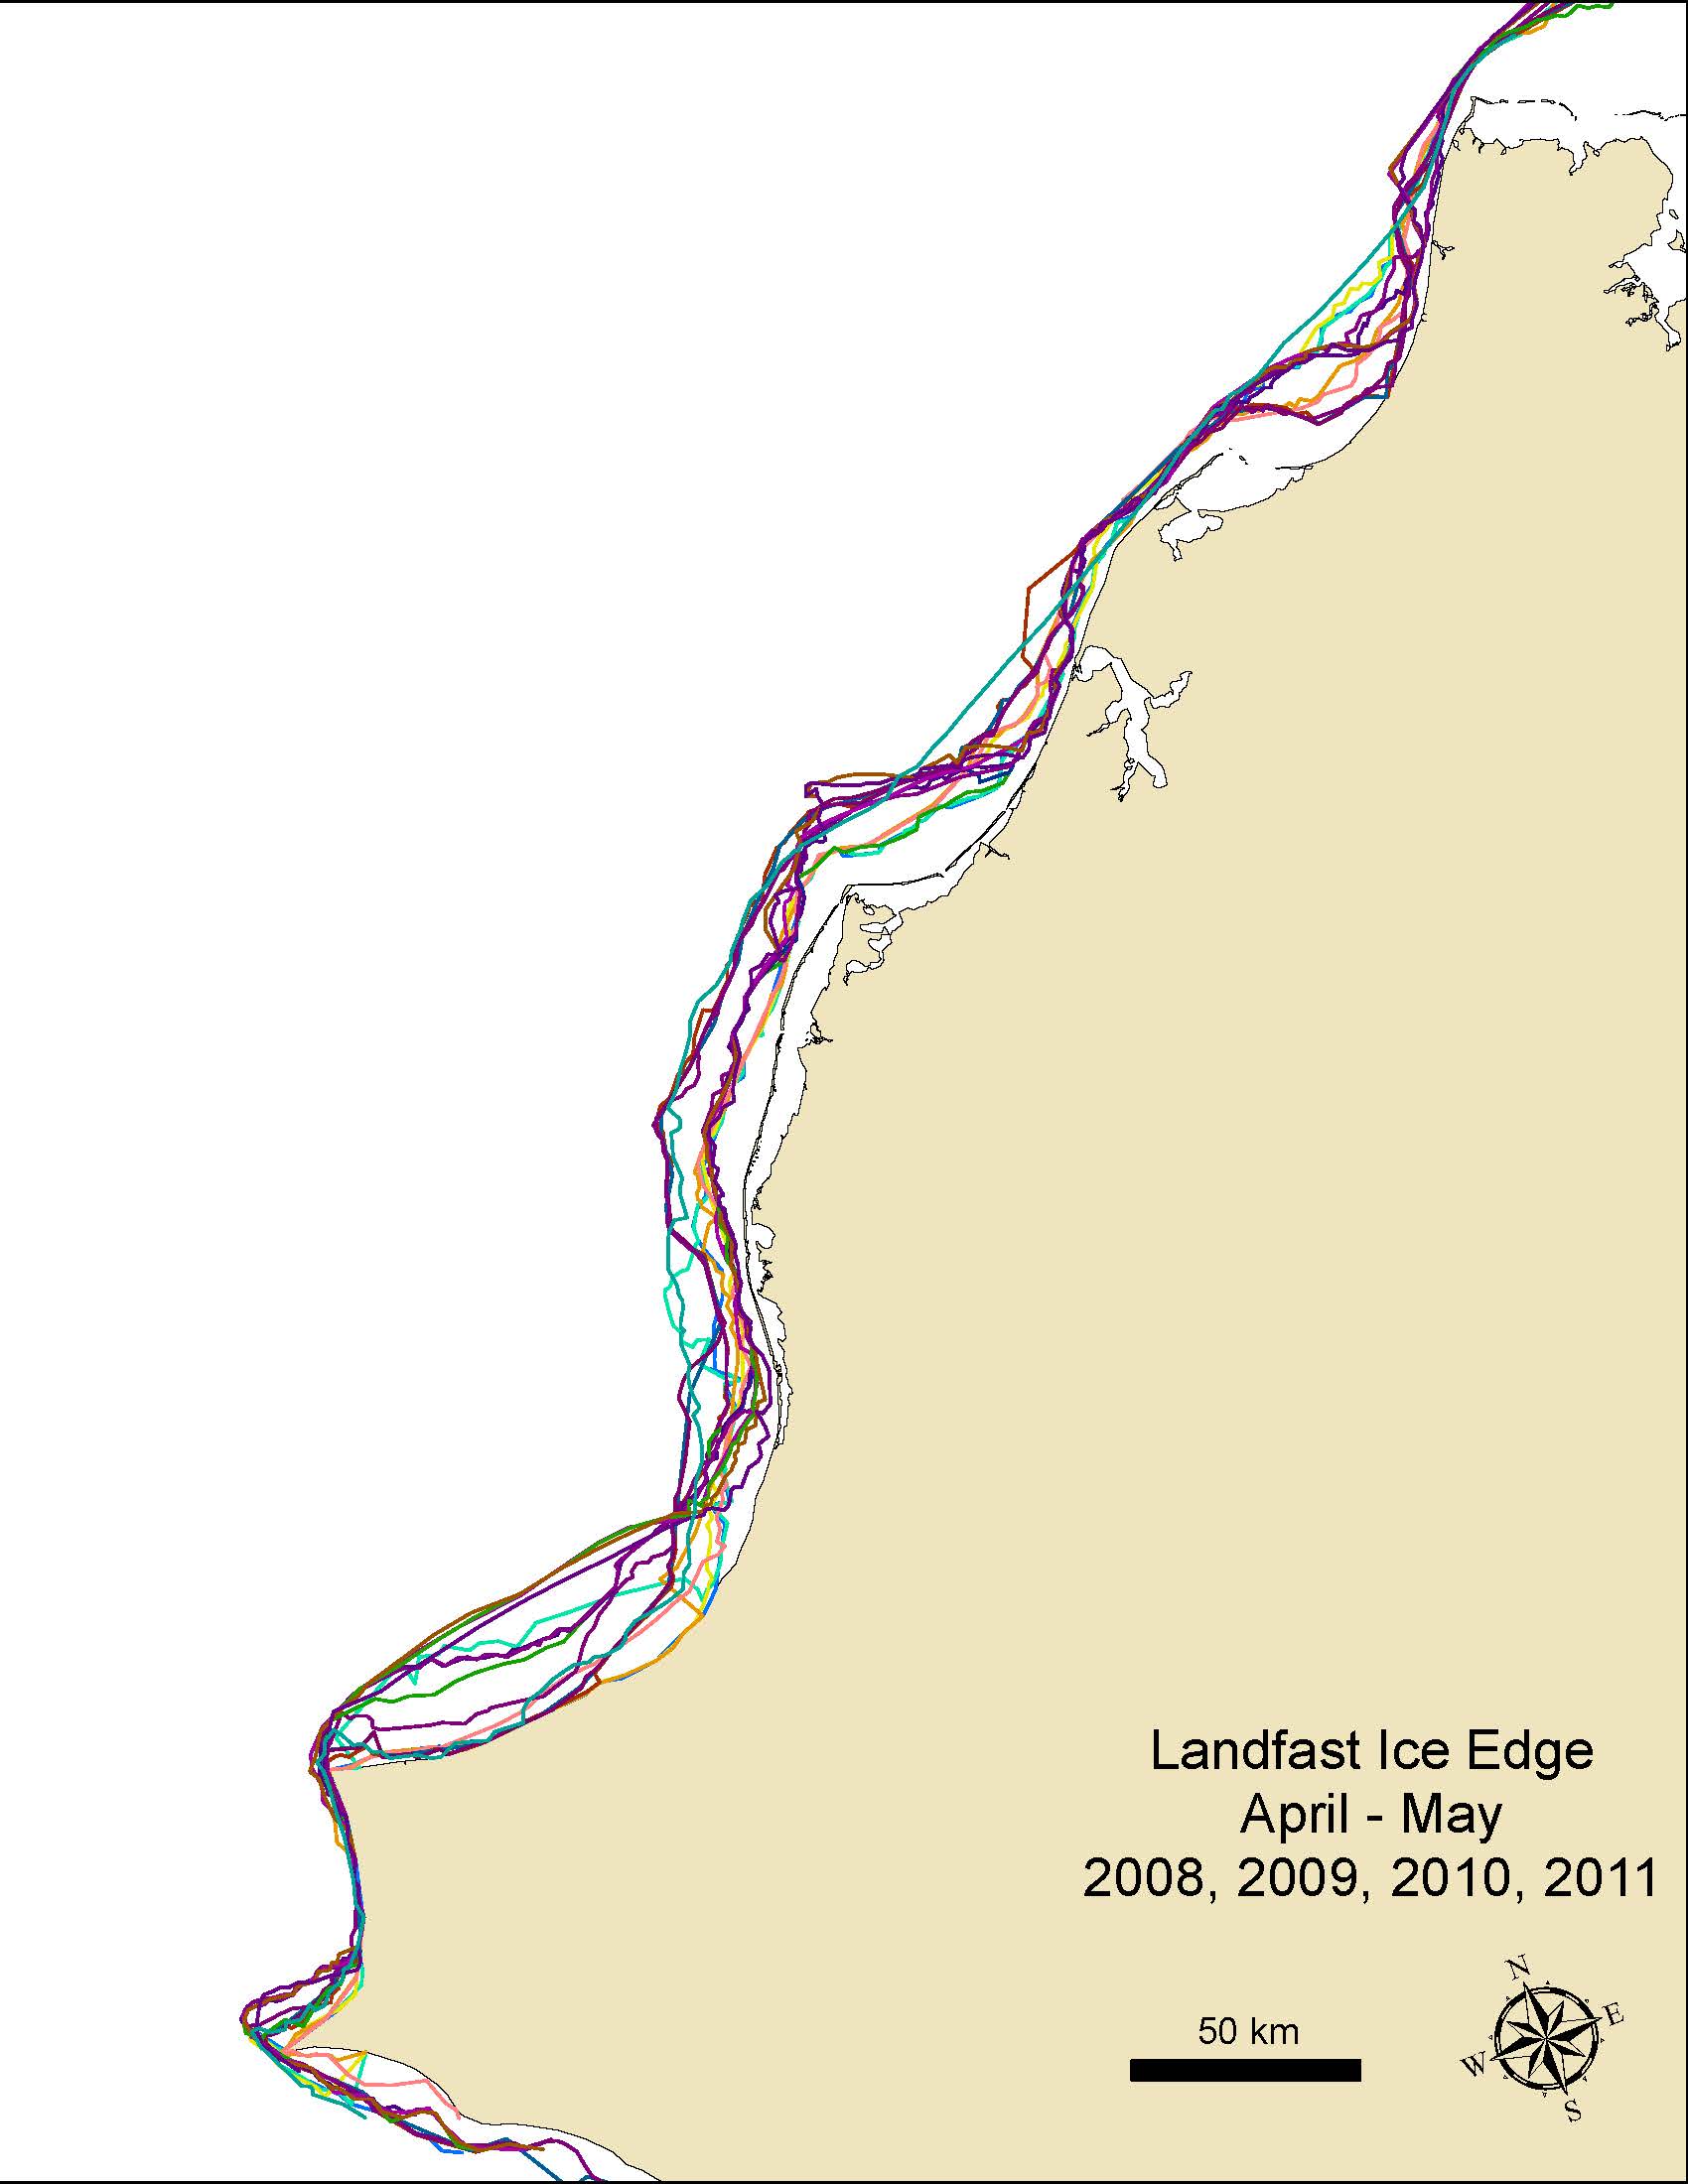
I have developed landfast sea ice extents that can be visualized as polygons, lines or rasters. Now I need to calculate monthly and yearly averages and it is much more difficult to create an average line from a set of polylines than I had imagined.
I first tried to use raster world and the Euclidean Distance tools to determine the distance from shore, but since the ice lines and the shoreline are so complex I needed a way to measure the distance from the same point on land or the averages are meaningless.
so, I developed a set of tangent lines and intersected them with my ice edge lines to get a set of points. I have been able to use spatial join to get the distances from shore and then add field and field calculator to get average distances along each of my tangent lines.
My plan is to then plot the average distances for each tangent line as a point and then connect the points to show the 'average' of my original ice edge lines for each month and year.
I think that I need to use linear referencing tools to get past this latest hurdle, so I created routes from my set of tangent lines. Now I need to create points that are my 'average distance' from shore but I am at a loss. I have minimal experience scripting and would appreciate help using the geoprocessing tools in modelbuilder.
Thanks,
Aariel
Solved! Go to Solution.
- Mark as New
- Bookmark
- Subscribe
- Mute
- Subscribe to RSS Feed
- Permalink
- Report Inappropriate Content
Xander,
I was called away for another project, so I am just now trying to apply your code. Could you explain more how files were set up prior to running the code? I have each of my ice lines in separate feature classes within a geodatabase, but am getting errors that runtime cannot open the ice edge files after line 40 (part of # loop through ice edges and create dct with polyline m values). it seems that I don't have the files in the proper format.
Thanks for your help
- Mark as New
- Bookmark
- Subscribe
- Mute
- Subscribe to RSS Feed
- Permalink
- Report Inappropriate Content
Hi Aariel Rocha , maybe the easiest way to explain it, is attaching the data so you can have a look yourself. With respect to the data the following is important:
# fc_coast = r'D:\Xander\GeoNet\IceEdges\data.gdb\coast'
fc_coast = r'D:\Xander\GeoNet\IceEdges\data.gdb\coast_simple'
fc_ice = r'D:\Xander\GeoNet\IceEdges\data.gdb\ice_edges'
fld_id = 'YEAR' # should be unique long
The fc "coast" and "coast_simple" are featureclasses that contains a single line describing the coast. The simplified coast line works best.
The ice_edges fc contains all the ice_edges and has a field called "YEAR" that has unique values for each ice edge.
I also included some of the intermediate results and the final result "result_v04" based on the simple coast line.
fc_routes = r'D:\Xander\GeoNet\IceEdges\data.gdb\routes_v04'
tbl_events = r'D:\Xander\GeoNet\IceEdges\data.gdb\tbl_events_v04'
fc_events = r'D:\Xander\GeoNet\IceEdges\data.gdb\events_v04'
fc_res = r'D:\Xander\GeoNet\IceEdges\data.gdb\result_v04
If you have any questions, please let me know.
Kind regards, Xander
- Mark as New
- Bookmark
- Subscribe
- Mute
- Subscribe to RSS Feed
- Permalink
- Report Inappropriate Content
Thank you kindly for your support on this problem. I have been able to apply the script properly, however when I modified the ice lines something strange happened. It seems that when the routes are created there is a sort of 'doubling back' in a straight line that throws of the results. Since the problem began when I modified length of the ice lines by clipping off the ends, I think it may have to do with the step setting?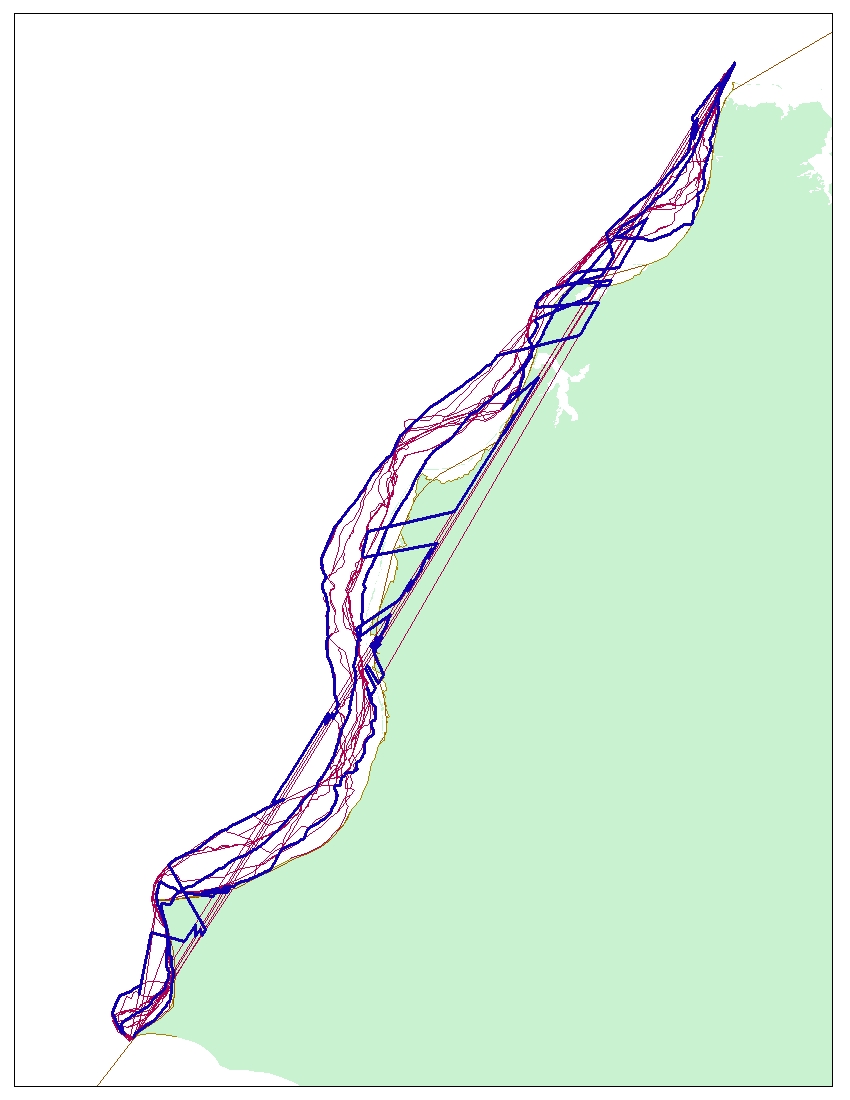
- Mark as New
- Bookmark
- Subscribe
- Mute
- Subscribe to RSS Feed
- Permalink
- Report Inappropriate Content
Hi Aariel Rocha , could you attach a sample of the modified ice line?
There could be several reasons for this behavior. Are the features still single part? If not this could be a reason since maybe the parts have different directions (some pointing north some south).
Another reason may be that there may be several features that have the same "YEAR"value. It is supposed that the field contains unique values (one feature per year). If this is not the case, you may need to dissolve the lines by YEAR and use the unsplit option and check if the features are created correctly (single parts).
- Mark as New
- Bookmark
- Subscribe
- Mute
- Subscribe to RSS Feed
- Permalink
- Report Inappropriate Content
Xander,
Each of my ice lines is single part, and all year values are unique. However, looking closely at my lines, I see that the offending ones have breaks in them 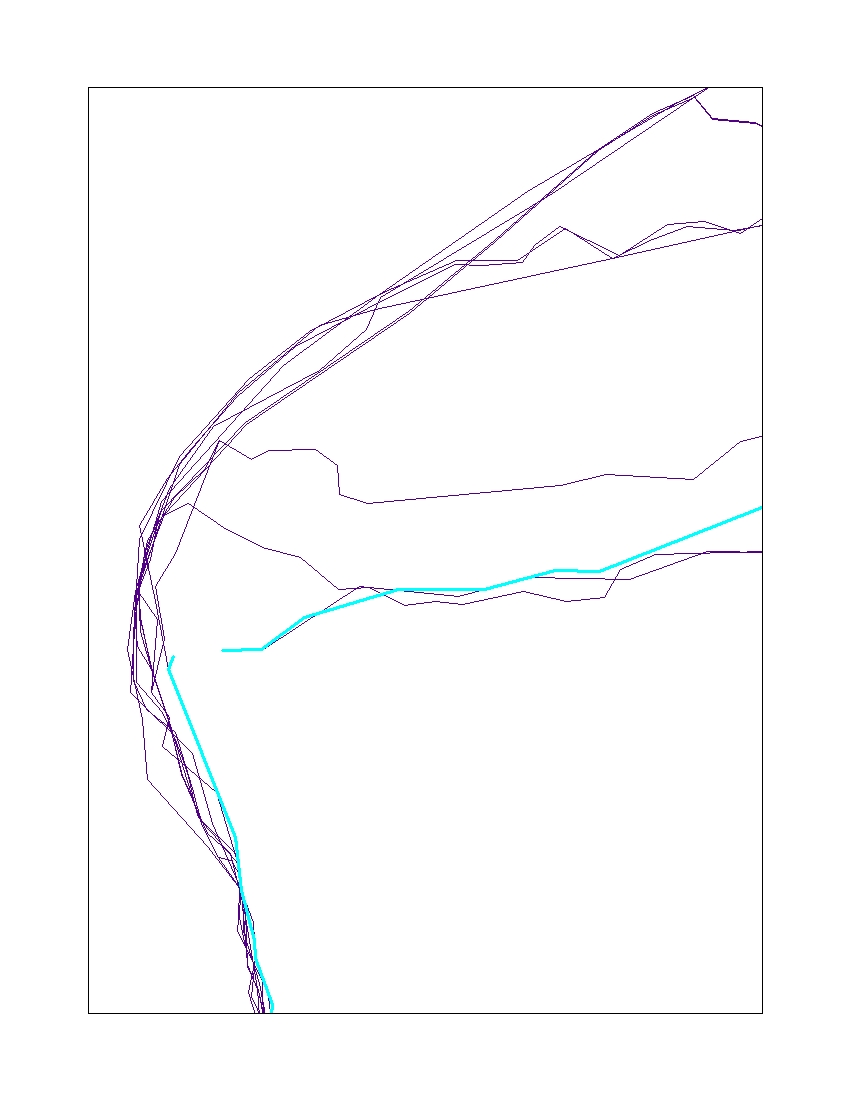 (and thus may behave as a multipart, I suppose). I will fix those and try again.
Thank you very much for your quick response. Your assistance has been instrumental in my progress and is much appreciated.
Aariel
- Mark as New
- Bookmark
- Subscribe
- Mute
- Subscribe to RSS Feed
- Permalink
- Report Inappropriate Content
That was it! I had clipped my ice edges to an outline of my study site and discovered some topology issues between the coastline and the ice-free areas of the coast. When I preformed the clip, some of the ice edges became fragmented and that threw off the results.
Now I have some nice summary statistics to work with. Thanks for your help (and extra brownie points for working weekends!)
- Mark as New
- Bookmark
- Subscribe
- Mute
- Subscribe to RSS Feed
- Permalink
- Report Inappropriate Content
Hi Aariel Rocha , I'm glad you found the reason for the problem. Indeed if you select a single feature and you see several "parts" light up, it is a multi part. Having multi parts will have a negative effect on the script. It does not handle them well, I guess.
I am glad to hear that the script is helping you to analyze the ice lines. If you are ready with the analysis and you are willing (and you are allowed) to share some results, it would be very nice to post them back at this thread.
If there is anything else, just let us know.
- Mark as New
- Bookmark
- Subscribe
- Mute
- Subscribe to RSS Feed
- Permalink
- Report Inappropriate Content
I will post my final figure once we get this work published. This has definitely been a great learning experience for me. Thanks again.
- Mark as New
- Bookmark
- Subscribe
- Mute
- Subscribe to RSS Feed
- Permalink
- Report Inappropriate Content
I just got this, but if you have the coast line and have the mean, median, or average distances in fields, you can use this distance field to buffer the coast line to created polygons, then convert the polygons to lines, then simply split the lines at the ends where you need to, you can choose to use square ends versus rounded ends. With this your lines are tied to the coast line. Just a thought.
- Mark as New
- Bookmark
- Subscribe
- Mute
- Subscribe to RSS Feed
- Permalink
- Report Inappropriate Content
I though this was an interesting problem, and, waffle-head that I am, went at it with an entirely raster approach.
- This conveniently avoids issues of topology!
- There's a lot of variability in these ice extent lines so I took the approach of averaging distances for equal length reaches of coastline, instead of thousands of tangent lines. You could simplify the coastline just for the allocation processing to straighten it enough to allow more bands if you wanted to split the coastline more.
I think this is a neat example of a problem that can be expressed and solved very simply using map algebra. That said, I am in awe of Xander's code up-thread. Xander probably provided a more accurate solution than this raster approach, pretty as it is.
from arcpy.sa import *
env.extent = "coast_simple"
env.cellSize = 10000
# create a raster of coastline cells
arcpy.PolylineToRaster_conversion("coast_simple", "OBJECTID", "ccell")
# Create coastline cell zones
# find the southernmost cell (this approach would vary with coastline config)
arcpy.RasterToPoint_conversion("ccell", "ccellpt")
arcpy.AddXY_management("ccellpt")
where = "ABS(POINT_Y - {}) < .001".format(arcpy.Describe("ccellpt").extent.YMin)
arcpy.MakeFeatureLayer_management("ccellpt", "cmin", where)
# Create 20 equal-length reaches along coast line
cc = ExtractByMask(CostDistance("cmin", Con(IsNull("ccell"), 1e6, 1)), "ccell")
cc1 = Slice(cc, 20, "EQUAL_AREA")
# separate ocean into areas corresponding to each coastline reach
calloc = EucAllocation(cc1)
# calculate distance from (any) coastline
cdist = EucDistance(cc1)
# get statistics for ice lines along coast for each year
for year in [2008, 2009, 2010, 2011]:
    arcpy.SelectLayerByAttribute_management("ice_edges", "", "YEAR = {}".format(year))
    ZonalStatisticsAsTable(ExtractByMask(calloc, "ice_edges"), "VALUE", cdist, "stats_{}".format(year), "DATA")