Turn on suggestions
Auto-suggest helps you quickly narrow down your search results by suggesting possible matches as you type.
Cancel
- Home
- :
- All Communities
- :
- Products
- :
- Spatial Statistics
- :
- Spatial Statistics Questions
- :
- Created Diagram looks crazy
Options
- Subscribe to RSS Feed
- Mark Topic as New
- Mark Topic as Read
- Float this Topic for Current User
- Bookmark
- Subscribe
- Mute
- Printer Friendly Page
Created Diagram looks crazy
Subscribe
3910
6
02-16-2011 04:43 AM
by
Anonymous User
Not applicable
02-16-2011
04:43 AM
- Mark as New
- Bookmark
- Subscribe
- Mute
- Subscribe to RSS Feed
- Permalink
- Report Inappropriate Content
Original User: nomeus
Hi there,
i want to generate a schematic diagram from bus lines. I have the Shapefiles of the Routes (Polylines) and the Bus stops (Points). Now i want to generate the diagram, to make the plans more readable (e.g. Smart Tree).
I had already read the 2 Tutorials of ESRI Webhelp and watched the Video on Esri Virtual Campus, but i didn`t found my fault yet.
First, i created a schematic diagram template with the 2 feature classes, as the tutorial shows it.
After this, i startet ArcMap und selected my Line-Features and clicked on "Create New Schematic Diagram" and filled in the formular.
I tried it with the normal shapefiles and after transforming them into a network, but nothing worked.
In the most tests, there were no entrys in the attribute tables of the result --> nothing to display.
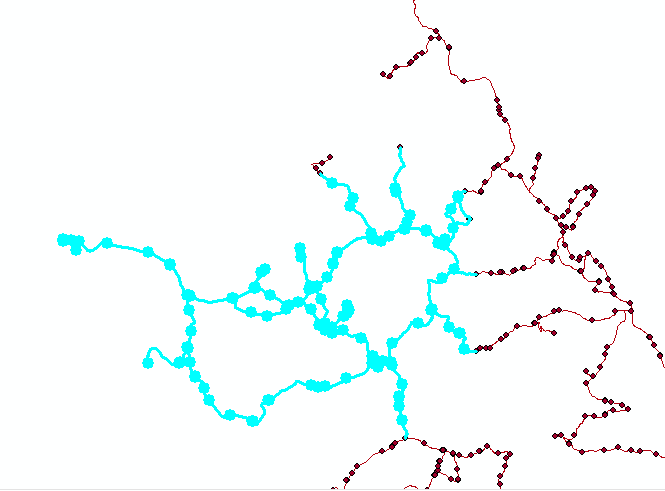
There was one "way to go" where i got a result, but ArcGIS offered me a crazy looking diagram (see attachment).
When i used the network builder instead, it was nearly working, but i always had to select/solve a route with the network analyst. So only the solved Route was displayed in my diagram and not the whole line-network.
I`m using ArcGIS 10 with Network Analysis and Schematics Extension. Can somebody please help me?
Best regards,
nomeus
Hi there,
i want to generate a schematic diagram from bus lines. I have the Shapefiles of the Routes (Polylines) and the Bus stops (Points). Now i want to generate the diagram, to make the plans more readable (e.g. Smart Tree).
I had already read the 2 Tutorials of ESRI Webhelp and watched the Video on Esri Virtual Campus, but i didn`t found my fault yet.
First, i created a schematic diagram template with the 2 feature classes, as the tutorial shows it.
After this, i startet ArcMap und selected my Line-Features and clicked on "Create New Schematic Diagram" and filled in the formular.
I tried it with the normal shapefiles and after transforming them into a network, but nothing worked.
In the most tests, there were no entrys in the attribute tables of the result --> nothing to display.
There was one "way to go" where i got a result, but ArcGIS offered me a crazy looking diagram (see attachment).
When i used the network builder instead, it was nearly working, but i always had to select/solve a route with the network analyst. So only the solved Route was displayed in my diagram and not the whole line-network.
I`m using ArcGIS 10 with Network Analysis and Schematics Extension. Can somebody please help me?
Best regards,
nomeus
6 Replies
02-22-2011
07:55 AM
- Mark as New
- Bookmark
- Subscribe
- Mute
- Subscribe to RSS Feed
- Permalink
- Report Inappropriate Content
The solution with Schematics and Network Analyst is based on one of the network solvers. So as you already saw, you need to solve the route and then generate a diagram based on the route. A route solver can have multiple routes inside it if needed, the documentation for network analyst will show you how to do that.
If you don't have a 'network' (network dataset or geometric network), then for schematics to use the data, you have to define the connectivity. So for your schematic link feature classes, you must create the OriginNode and ExtremityNode attributes and point them to fields (or a script attribute, function attribute etc... can be used) that contain the connectivity information. This is basically like doing a custom query type of diagram because there isn't a real network to give schematics the connectivity information and therefore you have to use attributes to do it.
It sounds like the best solution for your bus routes is to have 1 route layer that contains all the bus lines, then solve once and generate the diagram.
by
Anonymous User
Not applicable
02-23-2011
05:44 AM
- Mark as New
- Bookmark
- Subscribe
- Mute
- Subscribe to RSS Feed
- Permalink
- Report Inappropriate Content
Original User: nomeus
Hi Rick Anderson,
thank you for your answer!
I have a network dataset (built up from the polyline shapefile) with connectivity.
As you proposed, i try to have 1 route layer that contains all the bus lines, then solve once and generate the diagram.
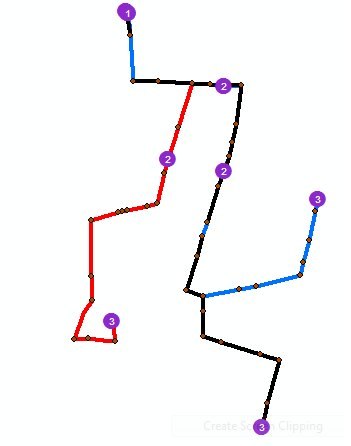
This works (more or less) fine for for the several bus routes. But additionally to the seperated routes, i want to generate one schematic diagram with all the bus lines. Like an overall plan (Example: http://farm1.static.flickr.com/213/501098400_8630592280_o.jpg ).
You mentioned, that a route solver can have multiple routes inside it if needed, but this property doesn't help me to solve them all at the sime time, or? I attached an image with 3 example routes.
Then i have to copy the attributes of the bus stops shapefile to the network dataset, to label them in the schematic diagram, but this is another problem...
Best regards,
Stefan
Hi Rick Anderson,
thank you for your answer!
I have a network dataset (built up from the polyline shapefile) with connectivity.
As you proposed, i try to have 1 route layer that contains all the bus lines, then solve once and generate the diagram.
This works (more or less) fine for for the several bus routes. But additionally to the seperated routes, i want to generate one schematic diagram with all the bus lines. Like an overall plan (Example: http://farm1.static.flickr.com/213/501098400_8630592280_o.jpg ).
You mentioned, that a route solver can have multiple routes inside it if needed, but this property doesn't help me to solve them all at the sime time, or? I attached an image with 3 example routes.
Then i have to copy the attributes of the bus stops shapefile to the network dataset, to label them in the schematic diagram, but this is another problem...
Best regards,
Stefan
02-25-2011
09:19 AM
- Mark as New
- Bookmark
- Subscribe
- Mute
- Subscribe to RSS Feed
- Permalink
- Report Inappropriate Content
It still looks like you have 1 route layer per bus route in your TOC. What I am suggesting is 1 route layer that represents all the individual bus routes. To do that, when you create a stop, you need to set the properties of that stop to a specific route name. So every stop gets a route name. If multiple busses go to the same stop, you will have multiple stops at that same location, each of them with a proper route name. Then when you solve it, you have 1 route layer that represents multiple bus routes. When you generate a diagram from it, that will be reflected. See my attached screen shots showing this concept. Multiroute.png shows the toc and the solver properties where you setup the different routes. Initdiagram.png shows the diagram generated from this multi-route solver. Finally, the afterpola.png shows the diagram after applying our partial overlapping links algorithm to separate the overlapping bus lines.
by
Anonymous User
Not applicable
03-01-2011
05:47 AM
- Mark as New
- Bookmark
- Subscribe
- Mute
- Subscribe to RSS Feed
- Permalink
- Report Inappropriate Content
Original User: nomeus
Yes! It works! Thank you very much! 🙂
Yes! It works! Thank you very much! 🙂
04-15-2011
06:01 AM
- Mark as New
- Bookmark
- Subscribe
- Mute
- Subscribe to RSS Feed
- Permalink
- Report Inappropriate Content
If you don't have a 'network' (network dataset or geometric network), then for schematics to use the data, you have to define the connectivity. So for your schematic link feature classes, you must create the OriginNode and ExtremityNode attributes and point them to fields (or a script attribute, function attribute etc... can be used) that contain the connectivity information. This is basically like doing a custom query type of diagram because there isn't a real network to give schematics the connectivity information and therefore you have to use attributes to do it.
Dear Rick and other interests,
the explained way with the Network Dataset and the Route Layer works fine.
Beside solving the last difficulties i would like to give a try at the other way with adding ExtremityNode & OriginNode (see quote), just to become more fimiliar with Schematics.
I read in the Webhelp, that ExtremityNode and OriginNode are predefined Variables.
So my question is, if it is sufficient when i add those 2 colums to the source shapefile attributes by a script? In the Cell's there would be the Informations about the ID (UOID?) of the Nodes next to every Line-Segment.
Are there already existing scripts who do this work? I didn't found one in the internet.
Is there something special to observe? Is my way of thinking to easy? Are there some problems i don't see?
I'm not sure if i really should believe, that schematics can handle the connections (directly) just by adding this 2 colums in the attribute tables 🙂 Even when the names are predefined: Do i have to tell schematics somewhere where it can find the connection-informations?
The Tutorial & WebHelp Informations are not very detailed in this case. They just give the same Information, as in the quote from Rick. But the ExampleData for instance, doesn't contain this 2 colums.
by
Anonymous User
Not applicable
04-22-2011
08:29 AM
- Mark as New
- Bookmark
- Subscribe
- Mute
- Subscribe to RSS Feed
- Permalink
- Report Inappropriate Content
Original User: 4233
Hi Stefan,
If you are using a network dataset or geometric network, then you do not need to ever do this as it is already handled. If you are doing custom query type of things, then you simply create the originnode and extremitynode attributes on the link schematic feature classes in configuration and point to the appropriate fields in the source table. So each schematic feature class that is a link needs to have both an originnode and extremitynode attribute configured to point to the correct field in the data (or run a query, function etc....).
There actually is a very detailed example in the help file, you must have just not seen it. In the schematicdataseteditor.chm help file, there is a book called Schematics Configuration Tutorials. Under that, open up Basic Configuration Tutorials and finally click on the Exercise 6: Quick start... item. Scroll through that one until you see information about configuring the ISP_PIPES feature class (link). It is all there.
Rick