User Conference Blog

cancel
Showing results for 
Show  only  | Search instead for 
Did you mean: 

Other Boards in This Place

Latest Activity

(126 Posts)
ChrisCatania
Esri Community Team

Welcome to the fifth and final day of UC coverage on Geonet! It's been an amazing week of connecting and collaborating with you all in San Diego and in the community.  The last day wrapped with the closing session featuring the Map and GeoNet awards, Jack's closing remarks and the Open Q&A session.  Here are some of the highlights and links to all the UC GeoNet coverage. Enjoy! 

Note: If you missed any of the GeoNet coverage, check out the list below: 

Closing Session Segments (click to jump to segment)

UC 2017 Map Award Winners

The following is a list of the winners for this year's Map Awards. Congrats to the winners and thanks to all who submitted your work this year! 

  • Best of Show: The Environmental Burden Index: Estimating Environmental Quality by Peer Group
    • Jessica Kolling, Ian Dunn, Brian Lewis; Centers for Disease Control and Prevention
  • Most Unique - The Emoji Map of San Diego 
    • Warren Vick; Europa Technologies Ltd.
  • Best Map Series of Atlas - Atlas of Conversation Opportunities in the Amazon Bione Under Climate Change Considerations
    • Johanna Prassmann, Ceasar Suajrez and Maria Elfi Chaves; WWF Colombia
  • Best Use of an API in a Map - FlowsMapper Poster 
    • Prepared by the Geography Division, Population Division, and Social, Economic and Housing Statistics Divison, U.S. Census Bureau
  • Best Story Map: Remember the Alamo in 3D 
    • Michael A. Garza, GISP; Pape-Dawson Engineers
  • Best ArcGIS Pro Map: The Union Canal (Fallkirk to Edinburgh)
    • Doug Cain; City of Fort Collins
  • Best Large Format Printed Map: A Perspective View of Gallatin County, Montana
    • Frank L Dougher; Gallatin County
  • Best Analytic Map: Modeling the Prehistoric Extent of San Francisco Bay and Potential for Cultural Resources
    • Paul Brandy and Shannon DeArmond; Far Western
  • Best Cartography Special Interest Group Map:
    • Santiam Pass Winter Recreation, Willamette and Deschutes National Forest; USDA Forest Service
      • USDA Forest Service, Pacific Northwest Region Cartography Unit

    • North American Natural Gas; S&P Global Platts
      • Ginny Mason

    • Alley Pond Park; NYC Parks
      • Ben Perry Blackshear

  • Best Instructional Map: Data Driven Pages to the Rescue
    • Corey Bowens, Michael Campbell, Bob Carberry, Paul Clement; St. Johns County
  • ICA Winners:
    • Geologic Map of Great Sand Dunes National Park, Colorado
      • Paco VanSistine, Richard Madole, Joseph Romig; U.S. Geological Survey
    • Relationship between geographical names and landforms with names of birds in Japan

      • Masataka Satoh

  • Best of User Apps Fair: Exotic Plant Information Collector (EPIC) 
  • Best Student Map up to age 12: Colored Community Map
    • Tri-County Preschool Class; Pro-West & Associates
  • Best Student Map ages 13-18: Geospatial Analysis of the Distribution of Sea Turtles and Sharks off the Coast of Long Island, New York
    • Sohum Sheth; Stony Brook University
  • Best Student Map - post-secondary, university, and postgrad: Pinpointing Vulnerabilities - Protecting Regions of the Arctic
    • Gabriel Rousseau and Kyle Lempinen; Bureau of Land Management, Oregon State Office

GeoNet Awards: 2016 Top Contributors 

Earlier this year we recognized the top GeoNet contributors Robert Scheitlin, GISP‌, Dan Patterson‌ and Rebecca Strauch, GISP‌ and it was exciting to give them a well-earned shout out at UC too. 

UC Facts and Stats 

  • 17,980 attendees 
  • 2,000 Esri Staff
  • 136 countries 
  • 326 Exhibitors 
  • 400+ students 
    • A special shout-out to the Student Assistant program. This program plays a crucial role throughout UC and in starting and further GIS careers after the event. You can get involved and learn more about it here
  • 900+ Young Professionals
  • 37 Plenary speakers
  • 314 Technical workshops
  • 133 Special Interest Groups
  • 407 Demo Theaters
  • 290 Paper Sessions
  • 900 Maps (Map Gallery)
  • 703 runners (Esri 5K)
  • 90,950 buttons (Did you get your first-edition UC GeoNet button?)
  • Many Lifelong learners!

The Road Ahead

Jack's UC 2017 farewell, "Thank you and I love you. See you next year! 

Thanks so much for following along! And a big thanks to all the guest contributors (Rachel Weeden, Dawn Wright, Joseph Kerski, Suzanne Boden, Adrian Welsh, Amy Niessen and many others)  who shared their experiences with us throughout the week. It was great to partner with you this year and expand the coverage and perspective of UC 2017.  

We hope you enjoyed UC 2017! We look forward to hearing what you're learned and what your biggest takeaways were from this year's event. Let's continue the conversation in the User Conference‌ group and in the comments below! 

more
8 2 9,661
ChrisCatania
Esri Community Team

Welcome to Day Four of our UC coverage here on GeoNet!  We hope you're having a great UC and enjoyed following along on the updates. 

Update: Check out each UC 2017 day recap: 

Day Four sections (click to jump to section)

Exploring the Kids Fair: Planting the seeds of GIS

The day started with a trip to check out one of my favorite times at UC: the Kids Fair. After hearing at the plenary how the 4H students have been using ArcGIS Pro, I was even more inspired as I walked around and saw the 6-11 year olds learning about geography from the Esri Training staff and creating maps with their parents. I'm pretty sure the next generation of geogeeks was born at the Kids Fair this week. I just wondered which one of these kids will be speaking at the plenary in 2025. 

GeoNet Meetup: Making the community better and how GIS creates new career paths

Then it was time to host the third and final GeoNet meet-up. Like we did earlier in the week, I shared success stories and updates on the GeoNet roadmap. Then we dove into the Q&A session, which was my favorite part as Daniel Inloes and Carol Kraemer shared several great ideas about how we can improve GeoNet and how to use the community for there organization. Carol asked if she could set up groups just for her team and I told her "Yes, we can!" And I explained how the GeoNet group strategy and setup process works. She also asked where new members can go to find out how to best use GeoNet. And I gladly shared how the GeoNet Help‌ group is designed just for that!

Daniel then shared a particularly interesting idea which was to create a virtual GIS and ArcGIS dictionary that users can access on GeoNet and use to search on too.  I told him I would take that idea back to our Esri and GeoNet team and see what we could do to make this happen.  

Daniel also shared an inspiring story about how GIS had played an critical role in his life and professional career because when we graduated college in 2008 the recession made it difficult to find work so he turned to GIS which gave him the opportunity to find a job and provide for his family, and that sent him on the path to where his today. 


Catching up with Adrian 

Adrian Welsh‌ continued to shared his adventures, insights and learnings as he made his way through the expo and other tech sessions. 


Dawn and the Day of Science

Yesterday was the world wide Day of Science and Dawn Wright participated and shared her experiences as the DOS was celebrated at UC. Check out more of Dawn's tweets as she continued to take us in and around the science side of UC. 

Geogeeking with Joseph Kerski 

UC isn't UC without spending time with Joseph Kerski.  I had the pleasure of geo-geeking out with Joseph and talking about his highlights so far this year. He was excited about what the 4H kids demonstrated during the plenary, how successful the EdUC conference was and how much progress he has seen in the GIS  education field in just a year. Each year Joseph does a UC "key themes" video wrap up so be sure to check back as we'll share the video when Joseph has it ready. Until then, check out the always helpful and informative previous blog posts from Joseph and the Eduction team. 


Update: Check out Joseph's final thoughts video below! 


Pop-up Chats: Talkin' neurogeography, emotional mapping

One of my favorite parts of UC is having the chance to talk with users about their work, what they think of the UC and what they are thinking about the future of GIS.  One of my favorite pop-up chats was with Russell Mercer‌. Russell gave a big "thumbs up" to the improved usability of UC mobile app and then we talked about the work he's doing with as the GIS administrator for Imperial Beach Public Works and how he was intrigued by the neurogeography topic explored in the plenary with Dawn Wright. That then lead us into a fantastic conversation about the future power of maps to enable us to map psychological and emotional experiences based on where we are located and how that would be valuable for retailers, mental health, public safety and many other industries. 

What great pop-up chats did you have this week? 

Who is moving to ArcGIS Pro?

Speaking of people, it was great to see GeoNet member contributions highlighted on the "Why people are moving to ArcGIS Pro" signs featured throughout the UC convention center.  I'm honored to say that our GeoNet community and the ArcGIS Pro‌ group have helped answer many questions users have about moving to Pro and you can explore the group find the details mentioned on the sign. Thanks to all the users and staff who have helped out and shared tips and experiences in the group! 

Discovering Helpful Python Tips

Speaking of helpful tips, I loved coming across Marc Mendez's Top Five Python‌ tips and tricks in the #ESRIUC twitter stream too. Great collection! What tips would you add to the list? 

It's Time To Celebrate: UC Party 

After a long and eventful week it was time to head to the Thursday night UC party. Like it always is, the party was a blast as geogeeks and their families and friends took over Balboa park in San Diego to celebrate a week-long adventure of sharing, collaborating and furthering the Science of Where. 

That's it for Day Four! Stay tuned for Day Five as we capture final thoughts and the closing session. 

What were your highlights from Thursday? What did you learn and enjoy the most? 

more
5 3 1,679
ChrisCatania
Esri Community Team

Welcome to Day Three of our UC coverage here on GeoNet! 

Note: If you missed any of the GeoNet coverage, check out the list below: 


Day Three sections (click to jump to section)

Esri UC 5K 

Who else still has Shakira's "Try Anything" still running through your head? I know I was humming it non-stop for sure.


Speaking of running, Wednesday began with the annual UC 5K race. Hundreds of Geogeeks raced around the marina quickly and swiftly applying the Science of Where with their feet, legs and lungs and about 130 to 165 beats per minute. Congrats to the winners and high-fives to all who ran with us! Check out a nice recap of the 5K from the Esri social media team. 

Now for the roundup of what happened on Tuesday and throughout the rest of the day on Wednesday. 

In the Expo with Esri Services, Hands-On Learning Lab, and Lifelong Learning

by Suzanne Boden‌ from the Esri Training‌ team. 

It seemed like it would be an impossible task to match the energy and excitement of Monday’s all-day Plenary session, but when the Expo doors opened at 9 a.m. sharp Tuesday morning, the same energy and geo-powered enthusiasm were there in abundance. Attendees came in with business on their mind—talking with experts to get questions answered, exploring the latest Esri products and partner solutions, and discovering tips and tricks to streamline their GIS workflows.

Perhaps nowhere was this on more display than at the Esri Services area, where the fairly small demo theater was packed for the first of 16 lightning talks presented throughout the day. The space was entirely full with dozens of people spilling out into the aisles on either side of the theater. The crowd grew even bigger when Esri instructor Nick Giner took the microphone at 10 a.m. for ArcGIS Pro – Top 5 Tips and Tricks. If the lightning talk crowd is a measuring stick, ArcGIS Pro is definitely one of the hottest topics at this year’s UC.

Wednesday brings 16 more lightning talks at the Esri Services area—a new one starts every half-hour. On Thursday, the Expo closes at 1:30 p.m., so there will be only seven lightning talks. See the list below—you’ll probably find at least one topic of interest.

Tip: Get to the theater early if you want a seat.

Hands-On Learning Lab

The Hands-On Learning Lab is also filling seats. It’s a popular place to sit down and focus on learning something new. With two dozen ArcGIS lessons, the Lab is a great space to build software skills while you’re at the conference. Located at the back of the Expo, just to the right of the Technical Support area, the Lab stations are consistently full.

Tip: To get a spot without waiting, the best time to visit is first thing in the morning or late afternoon.

Lifelong Learning Area

Late Tuesday morning at Lifelong Learning, we were excited to see a group of special visitors: the three 4H teenagers who impressed everybody at the afternoon Plenary session, along with their program leaders and fellow 4H members. In the photo below, that’s Austin from Tennessee on the left. He presented his GIS project on stage like a pro Monday, inspiring all the adults with his poise and excellent grasp of spatial analysis (not to mention his expert use of ArcGIS Pro). He’s holding a sign with Fran, a 4H program leader from Baton Rouge, Louisiana.

Seeing the cluster of blue 4H shirts buzzing around the Expo is one of the more fun people-watching activities for those of us working at the Expo. After the blue shirts moved on from Lifelong Learning, we enjoyed meeting with lots of other UC attendees. Questions about workforce development plans, e-Learning, ArcGIS Pro classes, and resources to prepare for an Esri technical certification exam were just some of the topics being discussed.

Tip: If you’re interested in certification, enter the July Giveaway for a chance to win a free exam voucher.

It’s hard to believe day 2 of the conference is already over. If you’re in the Expo Wednesday or Thursday, stop by the Esri Services area, Hands-On Learning Lab, or Lifelong Learning areas—we’d love to chat and answer your questions.

Hot on Developer Demos 

By Amy Niessen

If you haven't stopped by Demo Theatre 11, you may have missed out on some of the latest features in our SDKs and APIs! We have a number of demo presentations that will get you up-to-speed and in-the-know on different techniques and enhancements to guide your projects in the right direction. Read more about https://community.esri.com/groups/geodev/blog/2017/07/12/hot-on-developer-demos

Diving Deeper into the UC and EdUC with Dawn

Follow along with tweets and photos from Dawn Wright's experiences in the Map Gallery and at this past weekend's EdUC conference in this Storify collection: Esri UC, EdUC 2017 - Day 1 (Backstage) + Day 2 

GeoNet Meet-up (Video): The GeoNet Influence on ArcGIS Online

Want to know how the ArcGIS Online  team finds value in user feedback on GeoNet? Check out the video as Kelly Gerrow explains during the GeoNet Meet-up. 


Video: Creating broader community development

ByRachel Weeden‌ and Keith Cooke

Today at the Local Government/Community Development area, one of the hot topics was Economic Development. In this video, Keith Cooke summarizes a common conversation, describing how communities are moving beyond site selection solutions to support broader community development activities like destination branding. To give economic developers a competitive edge, they are not just providing information about available sites, but also the context as to the characteristics of the site and what might make a community unique. Keith shares a quick overview of Esri solutions that support destination branding, including the Live, Work, Locate app and Story Maps


YPN Party and GeoDev Meetup 

Wednesday came to a close as Geogeeks gathered at the GeoDev meet-up and partied poolside at the YPN social event. Good times were had by all. 

What were your highlights on Wednesday? What are you learning this week at UC? 

more
3 0 1,606
ChrisCatania
Esri Community Team

Welcome to Day Two of our UC coverage here on GeoNet! Here's a roundup of what happened on Monday after the plenary and on Tuesday. It's been nothing short of amazing to see all the action unfolding this year and I've been inspired hearing all the stories of how you're all applying The Science of Where. 

This is a collection of what I experienced as well as a range of experiences, reflections and insights from our guest contributors from their posts on GeoNet and across social media. We hope you enjoy the coverage and we invite you to share your thoughts and questions in the comments below. 

Update: Check out each UC 2017 day recap: 


Day Two Sections (click to jump to section)

The Inspiring Wall of Map Dreams and Big Projects

By Christopher Catania

Every time I walked by the "What do you love to Map?" What is your next project?" Wall on Monday and throughout Tuesday it became more and more covered with beautiful collage of creative expressions of big GIS projects and heartfelt hopes of how users want, or are currently, applying the Science of Where in their daily work and personal lives. I was pointing at building the GeoNet community (of course). I highly encourage you to stop by the Wall and look closely at all the contributions and make your contribution. It'll bring a big satisfying smile to your face. I know it did for me. 

Making Our Mark on the Emoji Map

On Monday in the Map Gallery I took my initial stroll through the wonderful display of user maps and I spent time contributing to the Emoji map, by Warren Vick from Europa Technologies (Map Gallery, panel F-15-01), which was an interactive map where you could place a sticker on the world map that had a special meaning for you. I placed three stickers on the map. I placed a plane emoji in Catania, Sicily, my family's hometown where I hope to travel some day; one heart emoji in Chicago where I grew up and recently moved from when I joined Esri last year; and one Mountain emoji in Southern California where I spend time running trails in the San Gorgonio mountains.

I really enjoyed the crowdsourced emotional experience of this map. It made me reflect of the ways we could continue to use maps to share and map our emotions in relation to meaningful locations, and by doing so, we can discover how our emotional experiences are connected geographically.

Then there was a very, very detailed map made up of a mosiac of emoji (wide and close up pics below). I love the detail of the mosiac map and how it was designed to make you think of the big picture and small micro emotions of a cityscape. At least that's what it made me think about. 

Both of these maps were some of my favorite because I felt like they encouraged me to think about three important elements: 1) my emotions, 2) where and why I felt those emotions and 3) how the location and feeling of my emotions is related to the same location and experiences as other people across the world. Ah, the combined power of maps and the Science of Where! Great stuff! 

Warren was also a winner of the Map Awards on Friday. Congrats, Warren! 

Did you stop by the Map Gallery? What emoji stickers did you stick on the map and why? What were some of your favorite maps in the gallery? 

 GeoNet Member citing in the Map Gallery!

I had another fantastic GeoNet Community Member citing in the Map Gallery as Alexander Nohe‌ stopped by to say hello and introduce me to Dave Watson who has a very impressive collection of UC button and lanyard tags. I had the chance to have great chat with Dave about the GIS work he does for the Boulder County Transportation. I also found out that Dave hadn't joined GeoNet yet, so we invite him in and to the Tuesday Meet-up and our community grew by one more on Monday! Welcome Dave!  

GeoDev Lightning Strikes!

By Amy Niessen‌ from the Geo Developers‌ team

At UC last night we hosted the Lightning Talks, and it was even better than ever! Even our new location didn’t thwart the interest that came into Ballroom 20A on Monday evening. With 19 presentations ranging from 3D to open data, users came from Brazil, New Zealand, Mexico, and even Africa to share some of the work they’ve been doing with Esri’s software in five minutes or less. With over 300 people in attendance, the speakers got a great sense of community and camaraderie  as they engaged and laughed along with the fun ideas and imagery that the presenters creatively played within their 300 seconds of glory. Read more from Amy's recap

GeoNet Community SIG/Meet-up

By Chris Catania

We hosted the first GeoNet Meet-up on Monday and shared the top GeoNet moments and wins since our last UC 2016  meet-up, as well as stories from Adrian Welsh and the Survey123 and ArcGIS Online teams.  

GeoNet Milestone Moments

To kickoff the SIG/Meet-up I shared a collection of highlights as we celebrated and took a look back on the big GeoNet moments and progress we've made over the last 365 days, which included. (Look for the full meet-up deck with GeoNet stats and road map later in the week.)

Adrian's story: How to use GeoNet "Like a 5-year-old"

During the meet-up GeoNet MVP Adrian Welsh shared the value he gets from the community. "I come to GeoNet to get help with my daily GIS workflow. GeoNet is especially valuable for those times in which you are doing something a little above and beyond your normal GIS duties and do not necessarily know how to do it.”

"If you come across a problem that you cannot solve using GIS, likely someone else has had the same problem and has been helped on GeoNet. This is where I find many of my answers to hard problems involving GIS."

If you haven't yet, be sure to check out Adrian's excellent series of "Explaining GIS to a 5-year-old" blog posts. He also is sharing his experiences at UC through the same  "5 year-old" point of view as he shares what he's learning about secret taco trucks and how to lie with maps and I'm looking forward to following along as the week continues. 


Reflecting on the Science Symposium

From Dawn Wright

Esri's Chief Scientist, Dawn Wright‌, spoke at the 2017 Esri UC Science Symposium and invited UC attendees to continue the conversation about making the world better with science communication.

Video: "Did You Know?" Business Analyst Tips for Local Government

By Rachel Weeden‌ and Adam Carnow

At this year's UC, I'm working at the Local Government/Community Development area, where we are highlighting solutions for Urban and Regional Planning and Economic Development. One thing we are highlighting is how local governments can use the ArcGIS Business Analyst ( Business Analyst)  web app to better understand the characteristics of their communities, to support more informed decision-making.  I was excited to see Juan Carlos share some of what's new in ArcGIS Business Analyst at Monday's plenary session, because I find a lot of people aren't aware of the data and capabilities it has to offer them. But don't let the name fool you - local governments can see a lot of benefit from using ArcGIS Business Analyst, specifically in the areas of economic development, planning and policy development. Adam Carnow and I hope you can find a few minutes to spend with us to learn more!

Video: Why Does GIS Give Our Student a Brighter Future? 

By Joseph Kerski from the Education team 

Like he did last year during UC, Joseph shared his insights about the impact of GIS on education. This time he shares an excellent and inspiring short video from the UC Expo floor about the 4 reasons why GIS gives students a brighter future and why that impacts all of us in a meaningful way. Enjoy! 

That's it for now! Be sure to check back on this post and the other daily posts as we continue to add more throughout the week. What have been your highlights this UC week? Share your thoughts below! 

more
4 8 2,402
ChrisCatania
Esri Community Team

We hope you've enjoyed following along the Morning Plenary Session Live Blog. Now, Matt Ball and I will take you through the Afternoon Session starting at 2pm and we look forward to seeing your feedback and contributions in the comments below! 

Update: Check out each UC 2017 day recap: 

Plenary Segments (click to jump to segments)

12:40 - Check out the UC 2017 Big Ideas Poster, Plenary Music Playlist

As we get ready for the Afternoon Session, we invite you to check out these two documents for additional info on what you saw and heard during the plenary.  Enjoy! 

2:00 - UnderstandingUnderstanding 

And, we're back! We hope you enjoyed the break and are ready to dive into the afternoon session. 

Jack welcomes Richard Saul Wurman, the prolific author, TED conference creator, and a longtime collaborator with Esri, to the stage to accept the Making a Difference Award at the 2017 Esri User Conference. Wurman has a passion for making difficult information easy to understand, and he has turned to GIS to help improve understanding on multiple projects.


He engaged with GIS technology on the Urban Observatory project, an interactive exhibit to compare and contrast maps of cities around the world. The app pulls live data and allows you to compare disparate cities side by side to get a comparative understanding of the makeup of cities.


Each of his 90 books springs from Wurman’s interest in understanding. His curiosity drives his inquiries, and he seeks to make the complex clear. He’s written a number of books with understanding in the title, including Understanding USA (1999), Understanding Children (2002), and Understanding Healthcare (2004). 


His latest book, UnderstandingUnderstanding, explores design by compiling many paths of understanding that lead to creation.

2:12 - Science and 25 Years of Education Applying The Science of Where


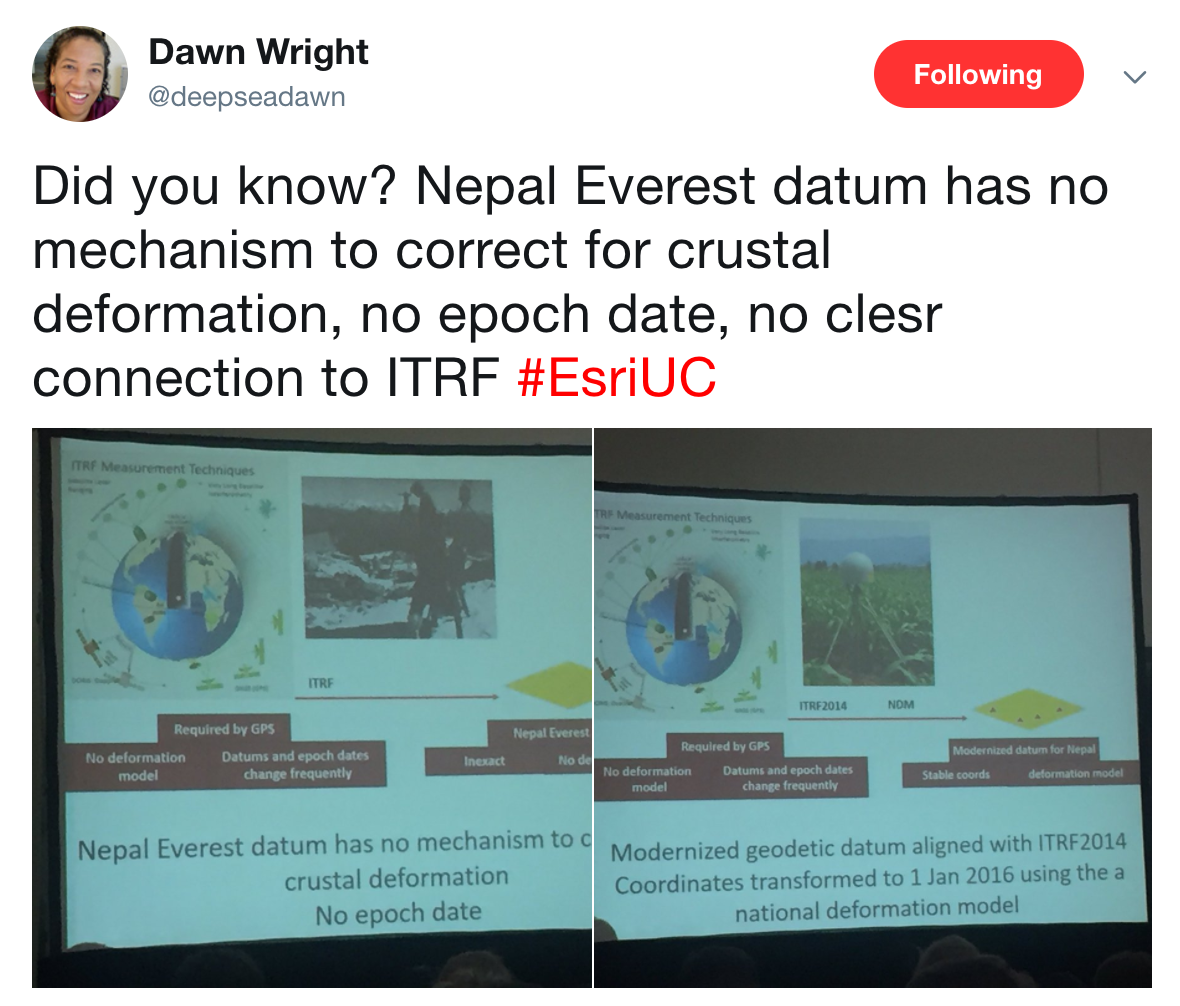
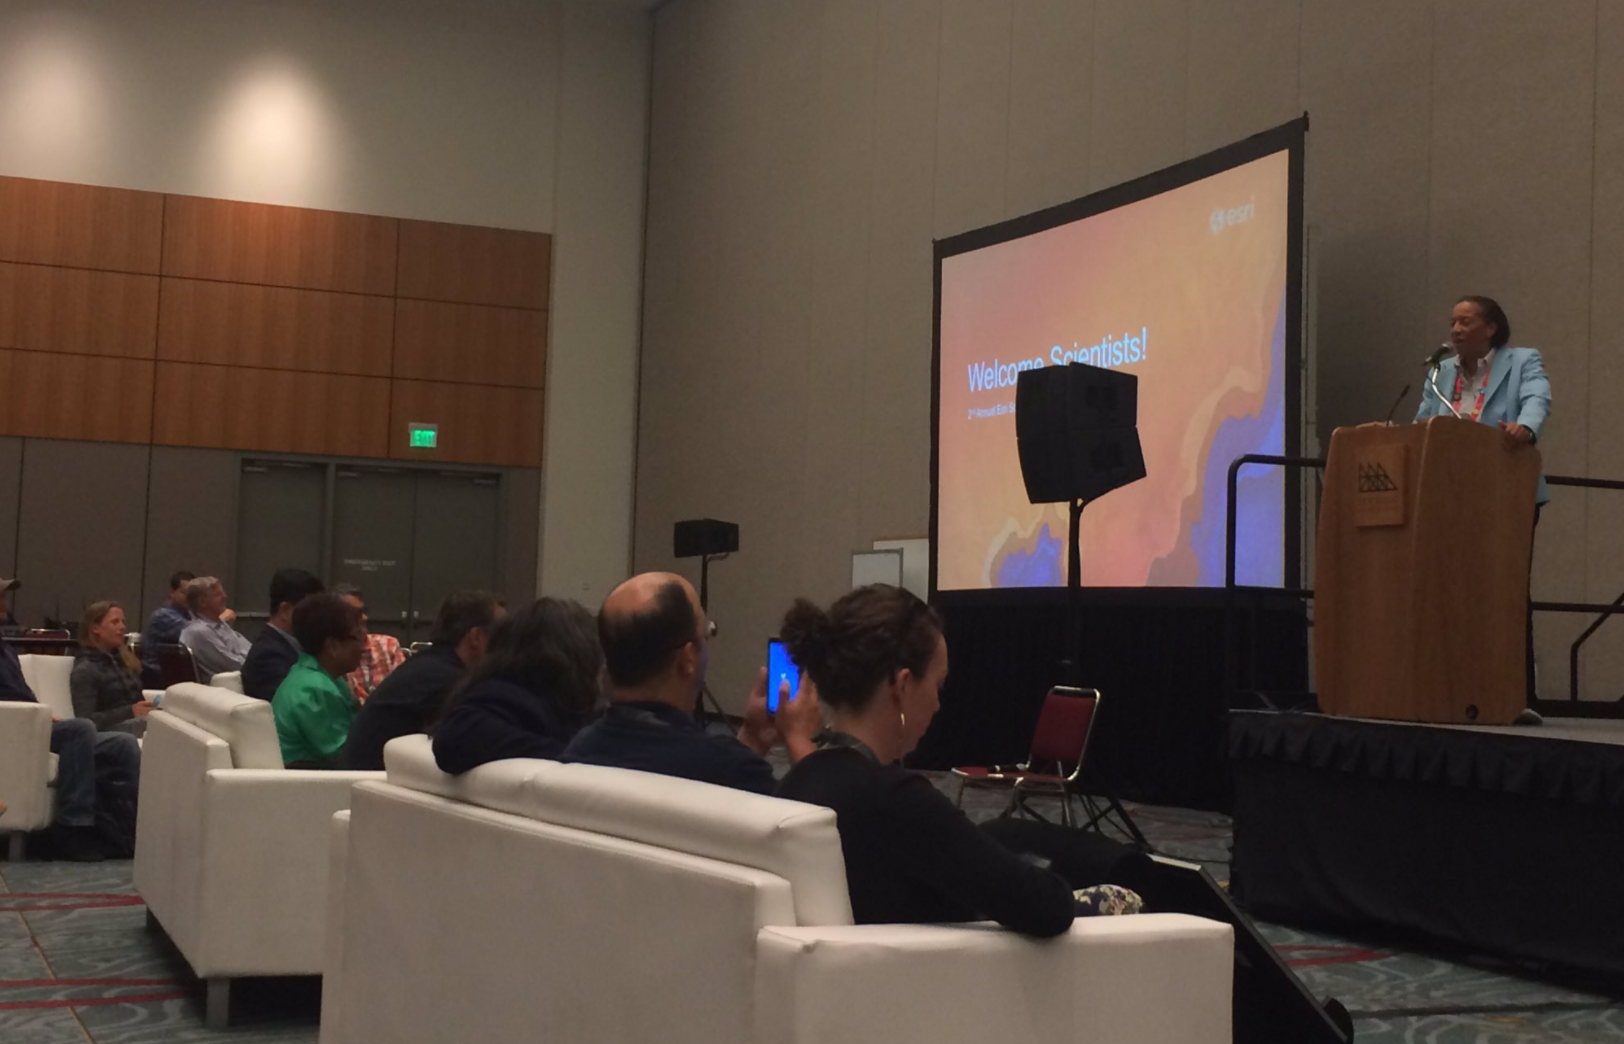
 Dawn Wright, Esri’s chief scientist introduces the Education (Education) segment of the program by first declaring, “I think we can all agree that education is the key to a brighter future.” She relates that education provides opportunities for all ages to shine.


Personal and professional development are enhanced from thinking spatially, which is one of the most powerful ways to make sense of the world. The new science of neurogeography examines how people are able to reason spatially. It’s looking at higher-order cognitive processes to discern geographic patterns and make important decisions at geographic scale. Neurogeographers are constantly scanning brains as their research subjects look at maps. Spatial thinking is a rich area that needs further understanding to show how spatial thinking impacts other mental activities.


This “brave new Digital Earth” demands that we rethink the role of education in our lives. Learning can become an entire way of life, rather than just a prelude to adulthood.


Wright encourages us all to engage in and pursue lifelong learning


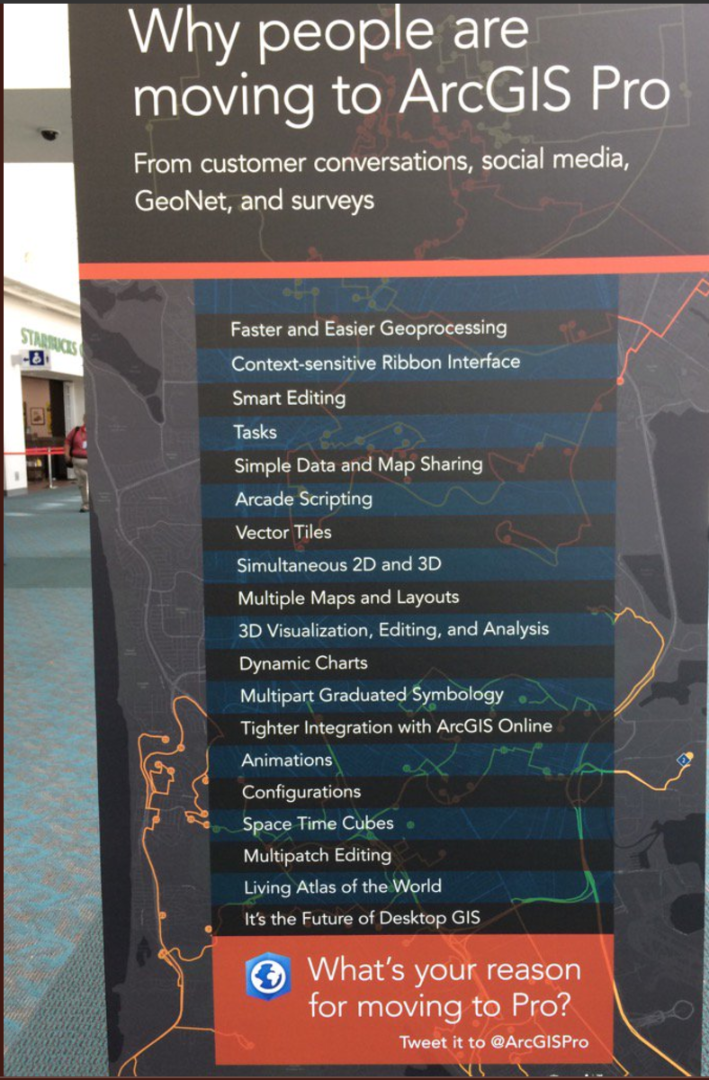
In higher education, the best approaches for STEM involve project-based learning. New digital curricula are pushing more engagement with digital textbooks students carry along on their phones. Jupyter Python notebooks, powered by the ArcGIS API for Python (ArcGIS API for Python), allow students to explore and experiment and innovate with live code and visualizations. This is expanding GIS into new fields.


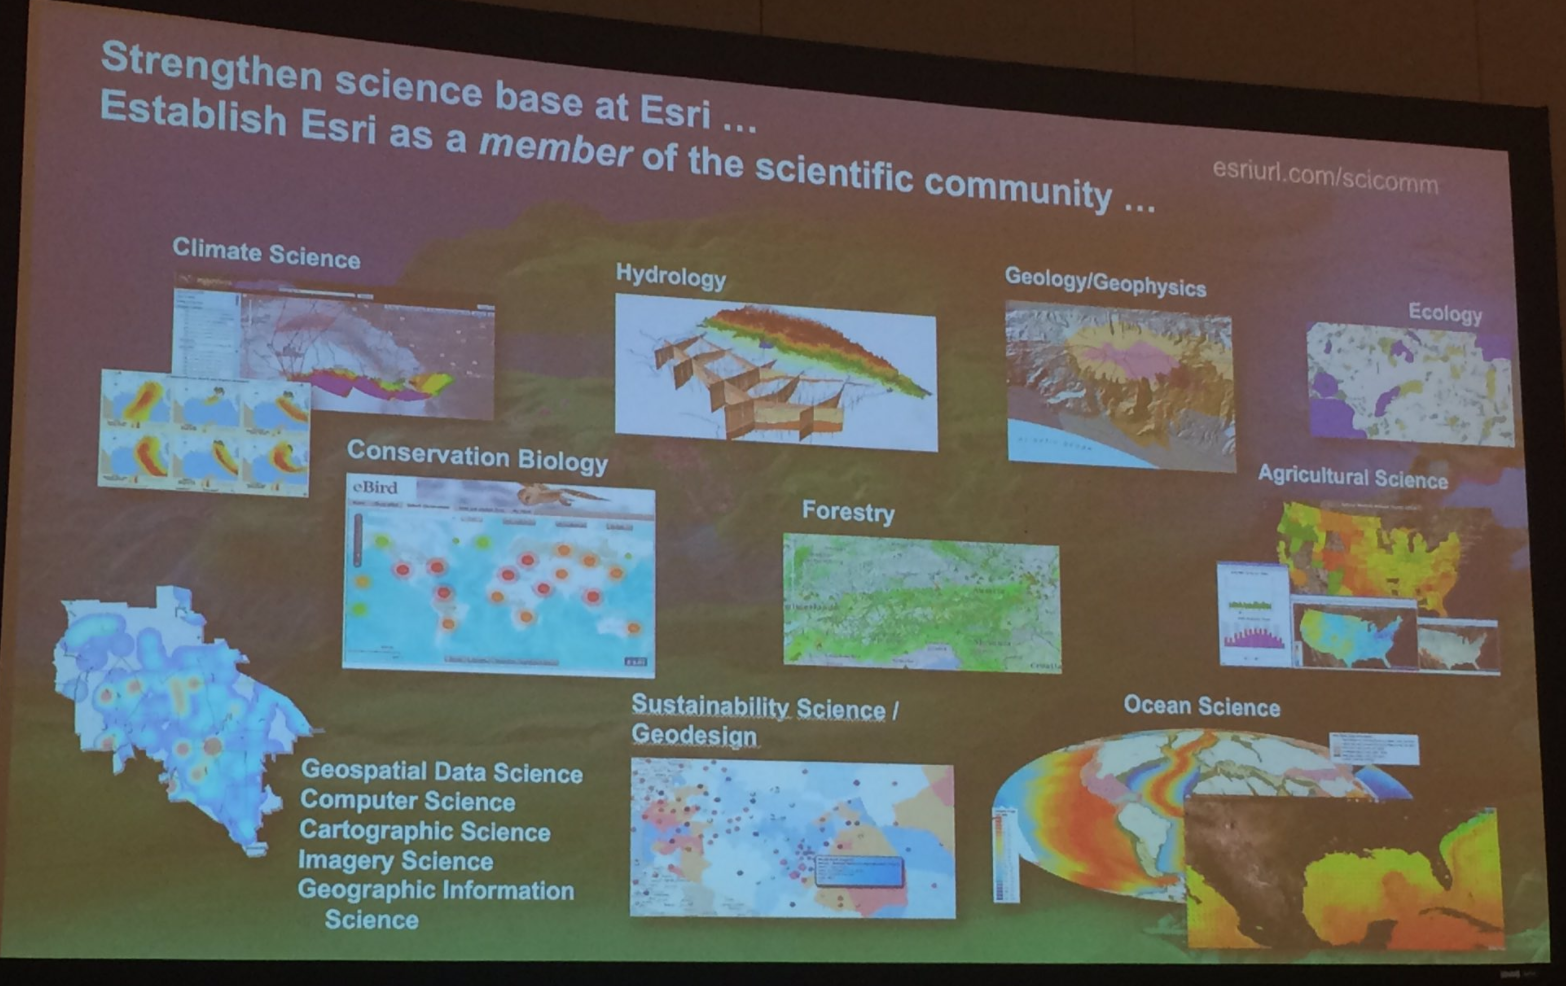
Wright encourages Esri users to share data with a college or university, consider using ArcGIS Open Data and ArcGIS Hub to empower open science. Ecological Marine Units (EMU) are a 3D map data from the ocean surface down to the ocean floor that are inspiring educators. She asks users to introduce an educator to more than 100 Esri crafted GeoInquiries that provide focused activities with pre-built maps on ArcGIS Online. She also suggests that users become GeoMentors to coach others on the use of GIS.


Learning is a lifelong voyage of discovery – and you can learn by passing on your learning.

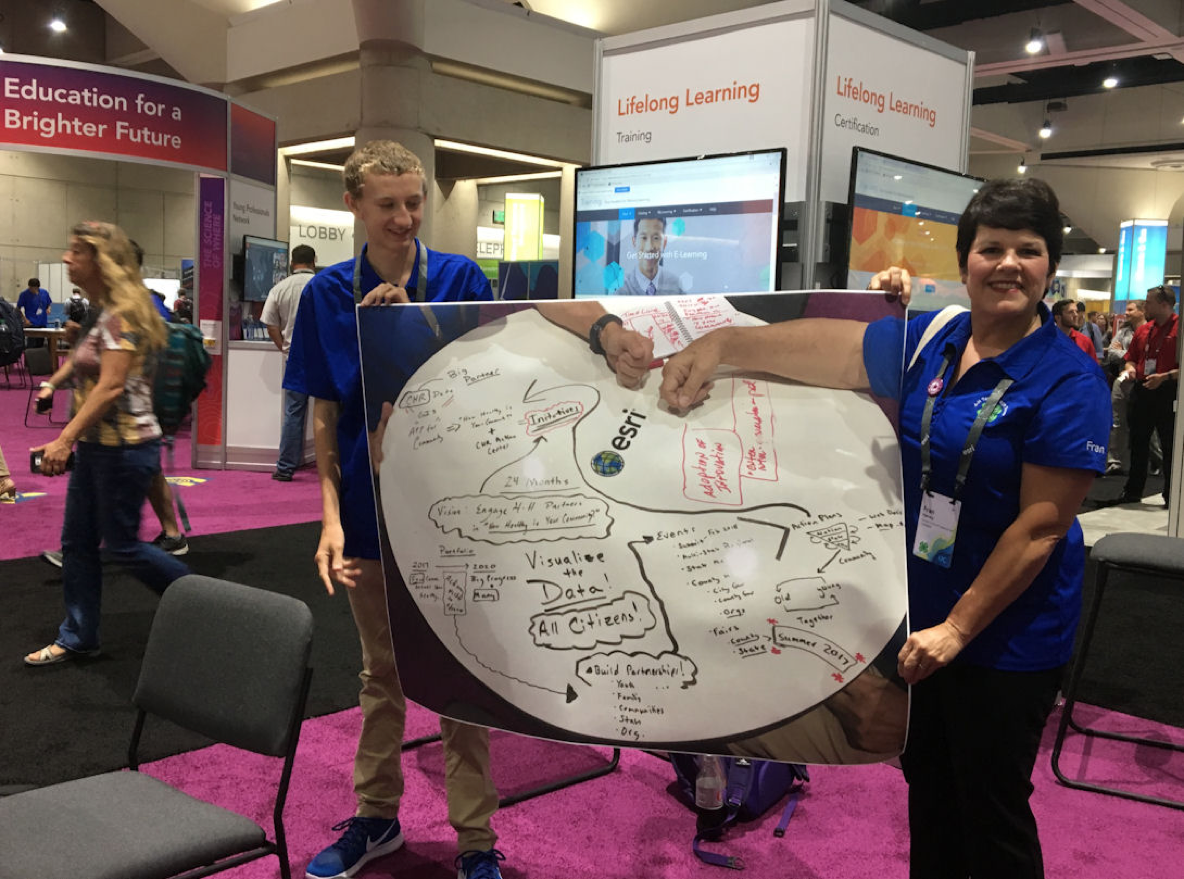
2:25 - 4H Class is in Session: Exploring Obesity and the Impact of Southern Cooking  

Dawn Wright introduces the team of 4H students. "We have three outstanding young scientists from the 4-H GIS program all the way from Tennessee: Austin Ramsey, Elizabeth Sutphin and Amanda Huggins. The students took a close look at the health in their county. They focused in on obesity, lack of exercise facilities, food security, and diabetes incidents."


They worked to map health across the United States. They did analysis on adult obesity across the country. They showed high obesity in the Southeast, and low obesity out West. They used the Optimized Hot Spot Analysis tool to see counties with low obesity that have counties with high obesity rates around them. They used the swipe tool to drag across the data to show the hot spots and dive into the data.


The charts feature was used to drill down into the data. Using the Definition Query they zoomed into Tennessee to see the obesity rates in their county.


Next, they picked child poverty, diabetes food insecurity and lack of exercise to compare to the obesity map. It returned box plots with mean lines that show the range in the dataset. There were some strong correlations between these four factors and obesity. It also raised a question about why the rates are high in some areas and low in others – something they’re still exploring.

When Jack asked why, the answer -- "It could be our Southern cooking."


Next, they created a Web App to share the information with the 4-H clubs across the US.

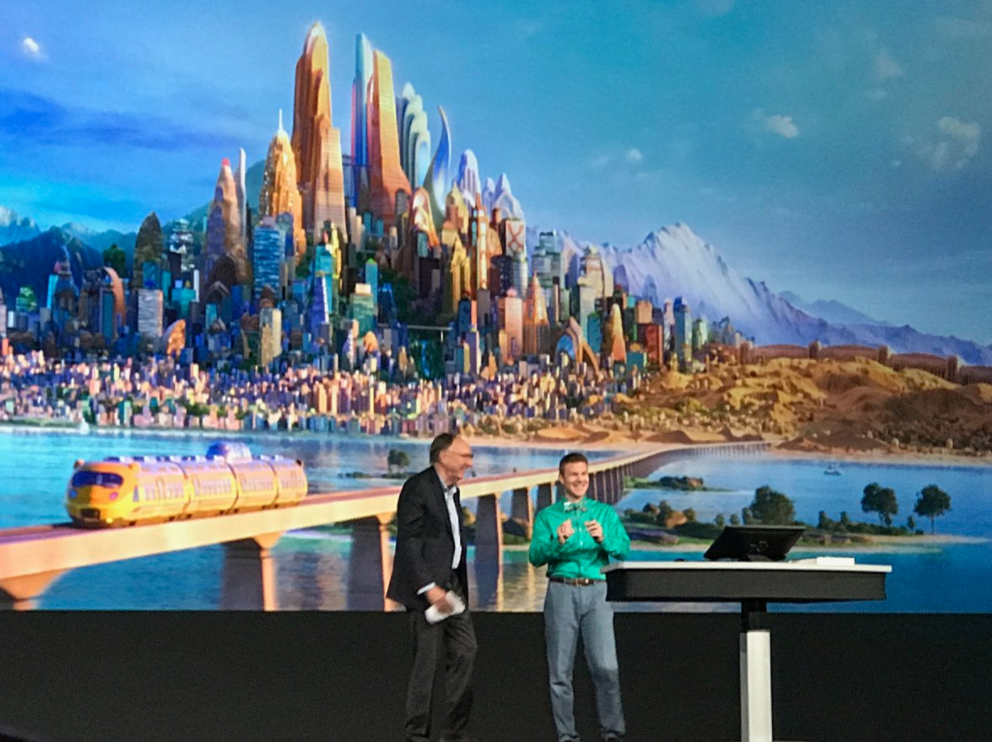
2:45 - Building Zootopia with a Unified Multilayer Map

Walt Disney Animation Studios has a stellar reputation for creating compelling stories, believable worlds, and appealing characters since its inception. It all started in 1937 with the first fully animated feature film, Snow White and the Seven Dwarfs, and the company has continued their masterful storytelling, beautiful artistry, and pioneering approach through the use of ground-breaking technology ever since.


Brandon Jarratt, General Technical Director at Walt Disney Animation Studios took to the stage to show how they used Esri’s CityEngine (CityEngine) procedural modeling software to create a believable world for the Academy award-winning film Zootopia, which won the Oscar for Best Animated Feature this year.


The film was directed by Byron Howard, co-directed by Rich Moore, and produced by Clark Spencer. The pitch for the move was a new take where animals act like humans in an animal world where humans haven’t existed.


“A city full of talking animals wearing clothes and using mobile phones is not exactly realistic – but ‘believable’ in that you believe the characters would actually inhabit that place,” says Jarrett.


In Zootopia, animals have evolved with predators and prey living together in harmony. This includes 70 species of animal from giraffes down to shrews. The goal was to create the geography, scale and style to complement and support the story. The effort incorporated elements of geodesign with an understanding of what the animals needed and creating a world that was livable for all.


The Walt Disney Animation Studios previously used Esri’s CityEngine during the production of Big Hero 6 to build the city of San Fransokyo. It helped achieve the scale and visual complexity based on the actual geography of San Francisco with Japanese-inspired architecture on top.


In Zootopia, the architecture was driven by the natural world with the thought that animals would prefer a more organic design. The designers started with giant rocks in China that look like skyscrapers and the organic architecture of Gaudi as examples.


The designers wanted to play with scales to have a city where a mouse and an elephant would interact in the scale appropriate to animals of all sizes, with big and tiny doors, and vehicles and streets of all sizes. The next driving thought was a city that was quartered for the different climates that animals inhabit.


The city started with an overall map and separate maps for each of the climate districts. Using procedural rules with shapes and textures unique for each district, and a library of buildings, dragging sliders achieved believable scale zoomed in and out to see the overall density and complexity.


A unified multilayer map helped drive the design thinking. In the Sahara district, they looked for a blockier honeycomb shape for the hot climate. They used carefully calibrated distribution rules to replicate the buildings across the landscape automatically. A street-level test render of Sahara Square was shown with building and color differentiation that looks believable. It’s made up of 61,000 parts.


The downtown core with buildings that grow taller as they climb the central hill, were easily rendered in CityEngine using a ramping silhouette. They first used procedural rules to generate some test plots, and iterated with feedback from art directors to reach something they were happy with.


Each district has thousands of parts, and overall there are more than 300,000 parts. The presentation ended with a video of the train ride sequence that demonstrates the results that were achieved across each district and the city as a whole.

Jack gave Brandon and his team the "Best Animated Feature Using GIS" award. Like it was Oscar night (before the "get off the stage"orchestra music started playing), Brandon quickly ran through his long list of thank you's giving a shout out to all his collaborators and, of course, his wife sitting in the front row. 

3:05 - Making a Smarter Dubai

H.E. Dr. Aisha Bint Butti Bin Bishr, Director General of the Smart Dubai Office, runs the Smart Dubai program. Their goal is to make the happiest city on the Earth with technologies that help transform, including technologies that make us closer to our friends and family.


Technologies that make the city safer and more seamless also make it happier. The inspiration of the transformation started in 1999 with an ICT strategy. The Smart Dubai initiative began in 2015.


The challenge was to unify the efforts underway in the public and private sector with a smart transformation. Data is at the heart of the city transformation. As the open data and insights initiative took hold, it’s increased the impact to the economy.


Geospatial technologies for maps and wayfinding are an important factor. The city has signed a citywide agreement to create a city cloud platform not only with the government but with the private sector.


Kaveh Vessali showed the Dubai Pulse, which allows everyone to learn more about places, events and project in real time. Distributed GIS is being used to improve mobility in a city that has tripled in the last 25 years. Anyone can take the pulse of project in planning, design or recently completed. Details of the project can be seen, including feedback from social media. Feedback helps to measure happiness.


Evidence-based decision making, with anonymized mobile phone data, allows the city to see the commute patterns of citizens. The city is a linear city, and it can take more than an hour to get from one end of the city to the other. Addressing road safety is a key initiative.


Hossam Sayed shared the Shams Dubai Calculator app that calculates the energy generated from solar power, allowing citizens to decide whether solar panels are a good investment. Smart environment requires smart infrastructure.


Hanan Huwair Al Zarooni demonstrated the D3 Dashboard for the Dubai Design District. There is a strong control system and property system, drilling down to the building view to understand space allocation and to show off real estate to potential tenants. They can look at the energy usage in the buildings with a command and control center to look at the status and analyze trends.


The next fifty years will continue the transformation. The city is implementing block chain to deliver trusted services, with plans to go paperless by 2021, to add 25% autonomous vehicles by 2030, and by 2050 to export its last drop of oil.


Smart Dubai is laying the foundation, and the first goal is to make the city the happiest on the Earth.

4:00 - The Science of Where, When and How with Dr. Geoffrey West


Dr. Geoffrey B. West, distinguished professor and former president of the Santa Fe Institute is a theoretical physicist whose primary interests have been in fundamental questions in physics, especially those concerning the elementary particles, their interactions, and cosmological implications. 


His long-term fascination in general scaling phenomena evolved into a collaboration on the origin of universal scaling laws in biology from the molecular genomic scale up through mitochondria and cells to whole organisms and ecosystems. This led to the development of realistic quantitative models for the structural and functional design of organisms based on underlying universal principles. 


West has received much attention in both the scientific and popular press for the framework for quantitative understanding of problems. His current interest is the extension of these ideas to understand quantitatively the structure and dynamics of social organizations, such as cities and corporations, including the relationships between economies of scale, growth, innovation and wealth creation and their implications for long-term survivability and sustainability.


His book, “Scale –The Universal Laws of Growth, Innovation, Sustainability, and the Pace of Life in Organisms, ...” explores these issues and forms the basis for his keynote address at the 2017 Esri International User Conference.


With growing populations, and increased urbanization, we need to add a city the size of San Diego each week. The growing urbanization, and the fate of humans on the planet, is bound up in the success of our cities.


When we think of cities, we think in terms of their physicality, the buildings and the boulevards. The most critical part of cities are the people, bringing people together, and facilitating interactions. They facilitate idea creation, wealth creation, and innovation.


The city can be thought about in terms of energy and infrastructure as well as exchange of information. Cities and urbanization are the problem in terms of pollution and environmental impact, but they are also the solution.


There’s an urgent need for an underlying science for cities. We tend to box this inquiry into health, economy, resources, energy, food, transportation, social, political, ecology, environment, and climate issues. For a deeper understanding, we need to think in integrated systems terms.


The laws of cities are not independent – they are all highly coupled, inter-related, and at multiple scales. They are complex adaptive systems that need understanding.


Metabolic rate of animals has an extraordinary systematic economy of scale. Slope exponents are typically sub-linear and simple multiples of ¼. All the animals that look so different are scaled versions of each other. It’s true of plants, birds, fish, and more. The underlying principles of networks drive this issue of scaling, and you can create mathematical formulas for all of these scales.


With cities, as you double them, you get a 15% savings on the infrastructure. Meaning that if you double their size, you just need 85% more roads, water lines, electric lines, etc. to serve the larger size. You also increase the socio-economic benefits.


These patterns happen throughout the world and without interaction. These scales are universal, and it’s just the universality of our social interaction networks, with a hierarchy of groups, that drives it all. We have a positive feedback mechanism for how we speak to each other, interact and share ideas.


The motion of everyone can also be mathematized, giving you the ability to predict movement in a city. All journeys are willful, from home to work and back, and so forth. The flux and pattern can be predicted.


Life also speeds up in a predictable linear way, such as an increase of walking speed as cities get larger. As speed and growth increase, it reaches super-exponential growth as it nears the singularity. Major innovations are the way to avoid collapse, however, we need to continue to innovate at a faster and faster pace.


What we have to do is redefine the idea of growth – not just economic, but in terms of quality of life. We also need to rethink innovation and paradigm shifts.


A revolution in social and cultural terms may get us out of this. We need to revolutionize our cultural values in order to reframe our fate. As we add more people, we cannot continue to consume the amounts of energy we are consuming.

And that's a wrap! Thanks for following along today and stay tuned for updates during the week in the User Conference group.  If you missed any of the morning plenary session check it out here. And be sure to check out these tools too:

more
8 8 4,553
52 Subscribers