- Home
- :
- All Communities
- :
- User Groups
- :
- Web AppBuilder Custom Widgets
- :
- Documents
- :
- Elevation Profile Widget Version 2.24 - 8/3/2022
- Subscribe to RSS Feed
- Mark as New
- Mark as Read
- Bookmark
- Subscribe
- Printer Friendly Page
- Report Inappropriate Content
Elevation Profile Widget Version 2.24 - 8/3/2022
Elevation Profile Widget Version 2.24 - 8/3/2022
Web AppBuilder for ArcGIS | Help - Elevation Profile Widget
List of the latest enhancements and changes:
- Added setting to change the coordinate system (WKID) of the exported profiles csv coordinates.
Older enhancements or changes
- Fixed issue with precision missing from settings UI
- Updated to WAB 2.17
- Fixed issue with using this widget in Tab Theme. Profile hiding the close button on the sidebar controller.
- Now when used in the Jewlerybox and tab theme it will open those controllers automatically.
- Added ability to select existing line features to profile.
- Added ability to choose which segment of the selected polyline to profile.
- Added setting to control elevation decimal precision.
- Fixed Issue with resizing widget and profile getting cut off.
- Moved all widget links to a widget menu instead.
- Added the ability to export Profile data to CSV file.
- Added the ability to flip the profiles direction of travel.
- Added support for doing profiles when basemap is not Web Mercator
- Added the ability to export the profile chart as an image (if you are not using Internet Explorer and your browser supports HTML5 Canvas).
- Added fix for Launchpad Theme UI issues
Features:
- This is a port over of the Elevation Profile Template.
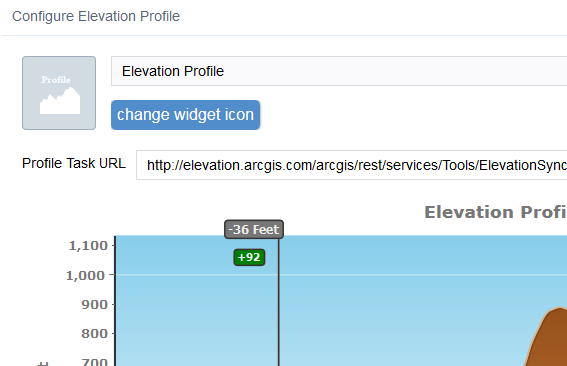
- Some modifications have been done to prevent chart indicator text clipping
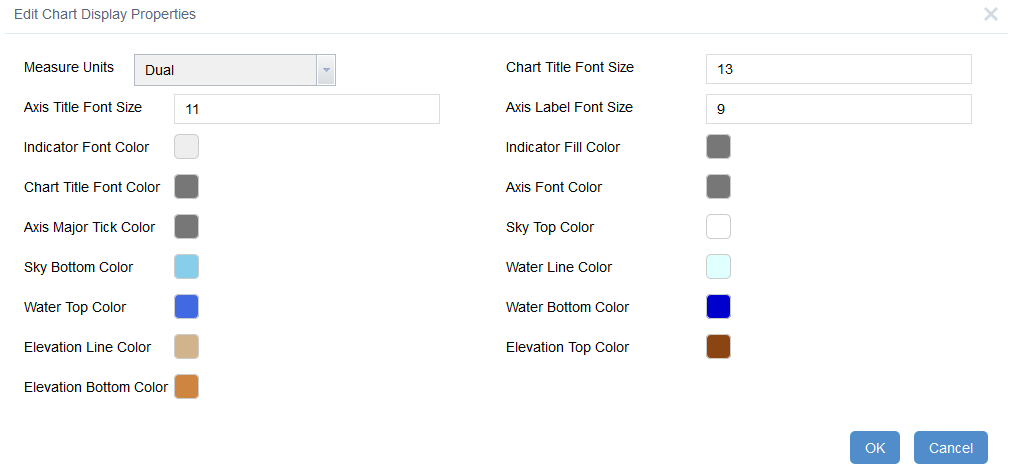
- The chart display features like color, font size, etc are all configurable in the widget settings UI
- Some validation is done on the profile task service url.
- Full help documentation is provided for configuring and using the widget.
- Mark as Read
- Mark as New
- Bookmark
- Permalink
- Report Inappropriate Content
Hi there,
I am looking for the function to change the decimals in the tool. Now it is in 1 metre increments, but an accuracy of two decimal places is desired.
According to the help document, this function is under the button 'Edit Chart Display Properties'.

However, this option is not available in our configuration. Am I missing something, or can I activate this option in a .js file?

- Mark as Read
- Mark as New
- Bookmark
- Permalink
- Report Inappropriate Content
@RickKlopping If that configuration option is not showing then you might be using an older version of the widget that does not have that option. Update to the latest version.
- Mark as Read
- Mark as New
- Bookmark
- Permalink
- Report Inappropriate Content
Robert,
I am having the same issue with the "Elevation value Percision" option not showing up in the tool settings. The version of the tool I am using is 2.17. Is this the latest?
name": "ElevationProfile",
"label": "Elevation Profile",
"platform": "HTML",
"version": "2.17",
"wabVersion": "2.17",
"author": "Esri & Robert Scheitlin",
"description": "This is the widget that will chart evelation profiles for the lines that the user draws",
"copyright": "2020",
- Mark as Read
- Mark as New
- Bookmark
- Permalink
- Report Inappropriate Content
Guys sorry for the confusion. There was a issue and that feature was removed unintentionally. I have added it back in the 2.17.01 version just released.
- Mark as Read
- Mark as New
- Bookmark
- Permalink
- Report Inappropriate Content
Great! Thank you Robert.
- Mark as Read
- Mark as New
- Bookmark
- Permalink
- Report Inappropriate Content
One strange thing I noticed:
When setting up the widget in WAB for portal, the settings menu shows the chart preview having decimal places. However, when I launch the actual app and try to use the tool, it still does not show the decimal places. Cleared browser cache thinking that was it, didn't help.
Does this same behavior happen on you end as well?
- Mark as Read
- Mark as New
- Bookmark
- Permalink
- Report Inappropriate Content
@smevans88 I missed a file change. Try redownloading and overwriting the widget again.
- Mark as Read
- Mark as New
- Bookmark
- Permalink
- Report Inappropriate Content
That was it! Thanks Robert. Great tool. My colleagues have been using it quite a bit.
- Mark as Read
- Mark as New
- Bookmark
- Permalink
- Report Inappropriate Content
Dear Robert,
Thanks for your advices.
Is there any provision to change the projection before export the coordinates in the new version? or any plans to add this option?
Could you please advise me the change in the below code, if any? I am not able to export coordinates in my desired CRS. Please help me.

Thanks in advance.
- Mark as Read
- Mark as New
- Bookmark
- Permalink
- Report Inappropriate Content
What if any errors are listed in your browsers web console? I made the changes above to the widget and then drew a profile line near Dezful Iran and it worked fine.
- Mark as Read
- Mark as New
- Bookmark
- Permalink
- Report Inappropriate Content
Dear Robert,
There is some error message in my browsers web console, regarding projection.js, I am providing the snapshot while working and error time.
When it is working without modifications

After modification in widget.js

Is there any updates required or is it our cyber security or proxy?
Please advise, thank you
- Mark as Read
- Mark as New
- Bookmark
- Permalink
- Report Inappropriate Content
@Aneel_Kumar_M the error tells you your issue. A 404 error means the file can not be found. And the reason it can not be found is the projection does not have a capital "P", it is lower case "p". So in your require array you have
- Mark as Read
- Mark as New
- Bookmark
- Permalink
- Report Inappropriate Content
dear Robert,
Thanks for the correction,
after I modified, I am getting the below error


any suggestions to overcome this?
thank you
- Mark as Read
- Mark as New
- Bookmark
- Permalink
- Report Inappropriate Content
Looks like you have some of your require module names and subsequent variables out of order. Each item in your define array has to match up with each variable in the preceding "function(" list.
define([
  'dojo/_base/declare',
  'jimu/BaseWidget',
  'dojo/Evented',
...
],
  function (declare, BaseWidget, Evented,
...
If you have one of these out of order then you have issues. But there are some modules like
- Mark as Read
- Mark as New
- Bookmark
- Permalink
- Report Inappropriate Content
dear Robert,
I did not find the 'projection' and 'LoadingShelter' in the function (declare, .......), so I have added them, then I got some other error , show below:

I have seen the jimu.js/widgetmanager.js, snapshot shown below:


Could you please check and advice, thank you
- Mark as Read
- Mark as New
- Bookmark
- Permalink
- Report Inappropriate Content
You should not be working inside the WidgetManager.js code. Your error is coming from the Elevation Profile Widget. So your changes need to be in the widget.js of the Elevation Profile widget only.
- Mark as Read
- Mark as New
- Bookmark
- Permalink
- Report Inappropriate Content
@Aneel_Kumar_M Version 2.24 now has the setting to change the csv coordinates.
- Mark as Read
- Mark as New
- Bookmark
- Permalink
- Report Inappropriate Content
Robert,
This is a great addition. Allows my colleagues to import into other software. Very helpful.
Thanks
- Mark as Read
- Mark as New
- Bookmark
- Permalink
- Report Inappropriate Content
@smevans88 If you downloaded when I posted the new version you will need to re-download. I found an issue in my first release.
- Mark as Read
- Mark as New
- Bookmark
- Permalink
- Report Inappropriate Content
Dear Robert,
Thanks for the update, now I loaded version 2.24, I got what I wanted 🕺💃🕺, great tool

Thank you so much and I appreciate your timely support 🙏🌹👏.
best regards 🌻,
- Mark as Read
- Mark as New
- Bookmark
- Permalink
- Report Inappropriate Content
Robert,
Are you able to confirm the data source you are using for this tool?
Thanks,
Scott
- Mark as Read
- Mark as New
- Bookmark
- Permalink
- Report Inappropriate Content
@smevans88 if you mean the elevation data source, it is the ESRI elevation GP service.
- Mark as Read
- Mark as New
- Bookmark
- Permalink
- Report Inappropriate Content
Thank you @RobertScheitlin__GISP .
I guess I was curious of the data behind it. Is it the 30m Ground Surface Elevation from USGS data? Or is it a combination of multiple sources?
Scott
- Mark as Read
- Mark as New
- Bookmark
- Permalink
- Report Inappropriate Content
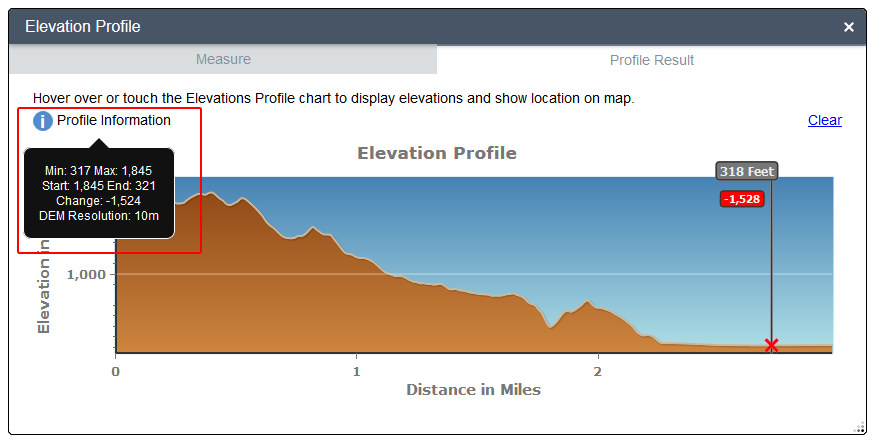
@smevans88 In the US it is 10m DEM resolution. You can see the profile resolution in this widget by performing a profile then clicking on the ... Menu button in the upper right corner of the widget and choosing "Profile Information".
- Mark as Read
- Mark as New
- Bookmark
- Permalink
- Report Inappropriate Content
Thank you @RobertScheitlin__GISP . I have been using the "Ground Surface Elevation - 30m" layer available for Living Atlas for other projects. Do you know if the 10m is ready available as a layer I can drop into Arcpro?
- Mark as Read
- Mark as New
- Bookmark
- Permalink
- Report Inappropriate Content
@smevans88 I do not.
- Mark as Read
- Mark as New
- Bookmark
- Permalink
- Report Inappropriate Content
@RobertScheitlin__GISP , thank you.
- Mark as Read
- Mark as New
- Bookmark
- Permalink
- Report Inappropriate Content
Hi Robert,
Thank you for your support and contributions! This widget is great and works really well on my hand! I wanted to know if it was possible to sample from two different elevation layers instead of one and have that represented in the graph? Is it just a matter of changing the geoprocessing service or would that also require to edit the app as well?
- Mark as Read
- Mark as New
- Bookmark
- Permalink
- Report Inappropriate Content
Hello.
As far as I know you need 2 services for your 2 models (e.g. DTM + DEM) and then adapt a little bit the widget to load and draw the 2 profiles.
I was able to do this pretty easilly from the source code available here.

- Mark as Read
- Mark as New
- Bookmark
- Permalink
- Report Inappropriate Content
@igemetristechnologies @RobertScheitlin__GISP
Hi, Thank you for the tip. Could you guide me briefly on this? I think I am not the only one who has asked if this was possible and I believe that would help many of us. As far as using publishing a second geoprocessing service is concerned, there is some documentation that exist (even if it's quite old and only documentation for using ArcMap) But for the widget adaptation part of it it would be great if you could provide some guidance as to where to even start.
Kind regards,
Jeremy
- Mark as Read
- Mark as New
- Bookmark
- Permalink
- Report Inappropriate Content
Is it possible if we would like to use our own elevation data/service? I saw a comment on this, and it said to change the Profile URL Task to the elevation service. Unfortunately, it was failed due to the error prompt "Invalid URL" although it has been changed in JSON file as well.
May I know the exact step to perform this? and may I know if these possible?
Many thanks.
Regards,
TS
- Mark as Read
- Mark as New
- Bookmark
- Permalink
- Report Inappropriate Content
Robert,
Not to alert yout but the widget doesnt work at all. I downloaded and placed it into a WAB i was working on and it errors on open and errors when attempting to create a profile. We're talking several hundred errors thrown
- Mark as Read
- Mark as New
- Bookmark
- Permalink
- Report Inappropriate Content
- Mark as Read
- Mark as New
- Bookmark
- Permalink
- Report Inappropriate Content
How do I add the Widget without at manifest file?
- Mark as Read
- Mark as New
- Bookmark
- Permalink
- Report Inappropriate Content
@RobertScheitlin__GISP Hi,
What's the best way to draw a horizontal line on the graph?
I want to draw a straight line from the starting point to the endpoint and make the line color green for example at the start, and it turns to red after it touches the first "brown" color plot.
Any suggestions on how to do that?
- « Previous
- Next »