- Home
- :
- All Communities
- :
- User Groups
- :
- Web AppBuilder Custom Widgets
- :
- Questions
- :
- Re: Incorporating graphs into eSearch Widget resul...
- Subscribe to RSS Feed
- Mark Topic as New
- Mark Topic as Read
- Float this Topic for Current User
- Bookmark
- Subscribe
- Mute
- Printer Friendly Page
Incorporating graphs into eSearch Widget results
- Mark as New
- Bookmark
- Subscribe
- Mute
- Subscribe to RSS Feed
- Permalink
- Report Inappropriate Content
I am using Robert's eSearch Widget to bring in some ACS census data in certain areas. Graphically, it displays the results like this:
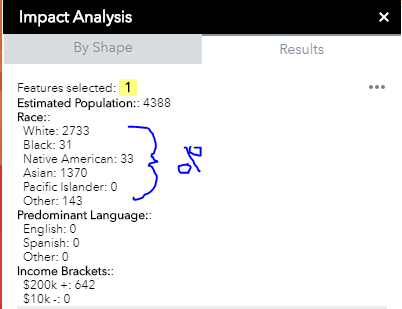
Lets say I wanted to display the race results as a pie graph. I can easily use `(Math.floor((Total Pop/RacialGroup) * 100).toFixed(1) + "%"); ` or something like that to get the percentage> I have no idea how I could create and insert a small pie graph in the Results under Race to display. Currently, I am using the following to display the results in the widget.js.
So, I am thinking that I need to perhaps look to layerConfig inthe config_eSearch.json perhaps to set something like this up. Any ideas or suggestions?
- Mark as New
- Bookmark
- Subscribe
- Mute
- Subscribe to RSS Feed
- Permalink
- Report Inappropriate Content
Thank You, but that is how I set up the info widget.
What I'm needing is some function to "open" the infographic chart from the eSearch.
Something similar to the "Zoom Too", Flash", etc.
- Mark as New
- Bookmark
- Subscribe
- Mute
- Subscribe to RSS Feed
- Permalink
- Report Inappropriate Content
Rich, I'd also like this.  As well as a direct way to open the Screening widget from eSearch to generate a tabular report. (the Screening widget creates great reports)
Perhaps for v. 1.1 of my site for the spring or summer.
- « Previous
-
- 1
- 2
- Next »
- « Previous
-
- 1
- 2
- Next »