Turn on suggestions
Auto-suggest helps you quickly narrow down your search results by suggesting possible matches as you type.
Cancel
- Home
- :
- All Communities
- :
- User Groups
- :
- Web AppBuilder Custom Widgets
- :
- Questions
- :
- plot function graph
Options
- Subscribe to RSS Feed
- Mark Topic as New
- Mark Topic as Read
- Float this Topic for Current User
- Bookmark
- Subscribe
- Mute
- Printer Friendly Page
plot function graph
Subscribe
1973
1
05-17-2016 09:05 AM
05-17-2016
09:05 AM
- Mark as New
- Bookmark
- Subscribe
- Mute
- Subscribe to RSS Feed
- Permalink
- Report Inappropriate Content
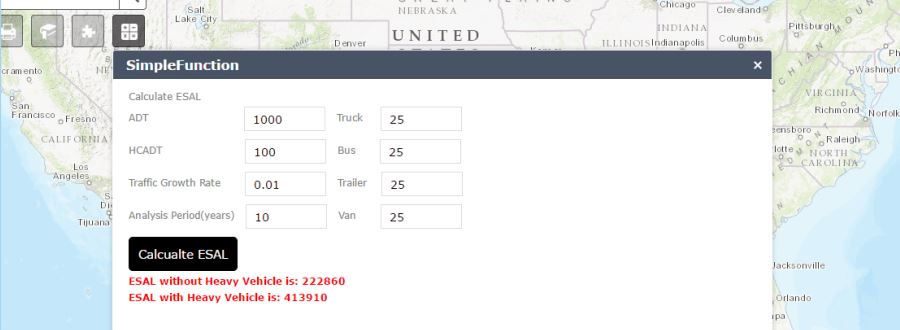
We need to show a plot which indicates the results from a model(function) using a widget.
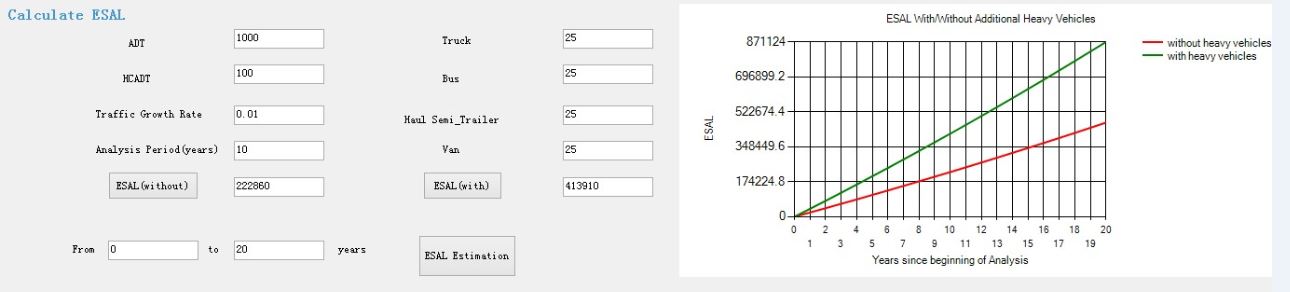
The figure1 shows we could calculate the results from the model at present. The figure2 is our expected plot.
Any suggestions to achieve this goal?
1 Reply
05-17-2016
09:15 AM
- Mark as New
- Bookmark
- Subscribe
- Mute
- Subscribe to RSS Feed
- Permalink
- Report Inappropriate Content
Junxuan,
I don't do anything with carting so the only advice I can offer is that you look at using dojox charting