- Home
- :
- All Communities
- :
- Products
- :
- ArcGIS Online
- :
- ArcGIS Online Questions
- :
- ArcGIS Online "Layer did not draw completely" mess...
- Subscribe to RSS Feed
- Mark Topic as New
- Mark Topic as Read
- Float this Topic for Current User
- Bookmark
- Subscribe
- Mute
- Printer Friendly Page
ArcGIS Online "Layer did not draw completely" message?
- Mark as New
- Bookmark
- Subscribe
- Mute
- Subscribe to RSS Feed
- Permalink
- Report Inappropriate Content
Hi,
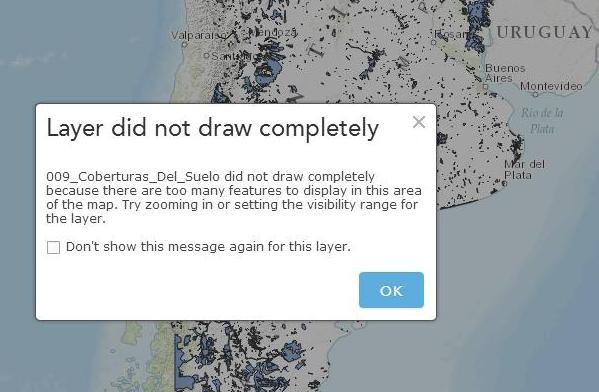
We are testing ArcGIS Online performance but, to our surprise, we are getting a “Layer did not draw completely because there are too many features to display in this area of the map”. Is this a known limitation? Any workaround?
Steps to reproduce:
1) Download the following zipped shapefile…
http://www.ign.gob.ar/archivos/sig250/publicacion-conae-2012/009_Coberturas_Del_Suelo.zip
2) Upload it into ArcGIS Online and finally draw it.
3) You should be getting the following message...
I will appreciate any help.
Thanks,
Alejandro
Solved! Go to Solution.
Accepted Solutions
- Mark as New
- Bookmark
- Subscribe
- Mute
- Subscribe to RSS Feed
- Permalink
- Report Inappropriate Content
Hi Megan,
Updated Answer:
When displaying large amounts of feature data in web maps and apps, there will eventually will be a point in time when the layer stops performing optimally and is visually confusing. For this reason, an exclamation marker will display indicating “Layer did not completely draw” in the bottom left corner of the web map. This occurs when there are more features or vertices that need to be displayed in a request area than can be returned by the server. Web apps and maps send several requests to the server, therefore there would need to be a dense area of features in a specific area of the web map to run into this limitation. The error will indicate that you need to zoom in to a specific area to draw all of the features. If you need to display large amounts of data consider the following questions and workflows to efficiently display large amounts of data:
- Can the geometry be generalized? If you are displaying data with complex geometry at small scales, use the optimize drawing feature and generalize the data at the small scales and maintain the complexity at large scales.
- Does the data need to be viewed at small scales? If the data needs to be viewed at large scales only, consider setting the visible range so that the layers will only draw when a reduced amount of data is requested.
- Is using a tiled service as an operational layer possible? With tiles creating automatically from changing feature layers, using tile layers are a great way to quickly draw large datasets. Check out this blog for more details.
- Mark as New
- Bookmark
- Subscribe
- Mute
- Subscribe to RSS Feed
- Permalink
- Report Inappropriate Content
I have had a similar issue. I created a tiled mapping service (basically a raster representation of the features) as well as a feature service. Set the tiled service to display down to a reasonable minimum scale (maybe 50,000) then have it turn off, and the feature service turn on from 50,000 as a maximum visibility scale. When zoomed out, you see the raster version, and as you zoom in past the scale limits, the features draw and become accessible.
Best Regards,
Jim
- Mark as New
- Bookmark
- Subscribe
- Mute
- Subscribe to RSS Feed
- Permalink
- Report Inappropriate Content
I realize this is three years after the fact, but do you happen to know if this still works?
- Mark as New
- Bookmark
- Subscribe
- Mute
- Subscribe to RSS Feed
- Permalink
- Report Inappropriate Content
Hi Megan,
Updated Answer:
When displaying large amounts of feature data in web maps and apps, there will eventually will be a point in time when the layer stops performing optimally and is visually confusing. For this reason, an exclamation marker will display indicating “Layer did not completely draw” in the bottom left corner of the web map. This occurs when there are more features or vertices that need to be displayed in a request area than can be returned by the server. Web apps and maps send several requests to the server, therefore there would need to be a dense area of features in a specific area of the web map to run into this limitation. The error will indicate that you need to zoom in to a specific area to draw all of the features. If you need to display large amounts of data consider the following questions and workflows to efficiently display large amounts of data:
- Can the geometry be generalized? If you are displaying data with complex geometry at small scales, use the optimize drawing feature and generalize the data at the small scales and maintain the complexity at large scales.
- Does the data need to be viewed at small scales? If the data needs to be viewed at large scales only, consider setting the visible range so that the layers will only draw when a reduced amount of data is requested.
- Is using a tiled service as an operational layer possible? With tiles creating automatically from changing feature layers, using tile layers are a great way to quickly draw large datasets. Check out this blog for more details.
- Mark as New
- Bookmark
- Subscribe
- Mute
- Subscribe to RSS Feed
- Permalink
- Report Inappropriate Content
HI Alejandro...
How are you? I see you're still doing GIS...
Here's a post from a while back that should help explain this:
Who can make this  ESRI'S reply simple and easy to understand ?
Thanks,
Mike
- Mark as New
- Bookmark
- Subscribe
- Mute
- Subscribe to RSS Feed
- Permalink
- Report Inappropriate Content
Hey Mike!!!
What a great surprise!
Yes, I am back in the GIS arena ...but this time *RELOADED!!! *Ha! Ha! Ha!
Yes, I got it now. Thanks a lot for the link. Very clarifying discussion.
Take care and please say hello to Reyad 
Thanks a lot.
Alejandro
2014-09-12 12:30 GMT-03:00 Mike Minami <geonet@esri.com>:
GeoNet
<http://jiveon.jivesoftware.com/wf/click?upn=Dg1s4x8le7Lmxv8KWGaqo8h7SGfRSMkw-2FpvHGF9-2FW3rK-2Bvs1kL9-2FnG6jjf2NZhrLDz0M-2BrY-2By9IaziQEKVk3Hg-3D-3D_bqT196RXALHHwSvsKam0FZ1Cs90ihnJY4fs9KfIu7T1OLYXxMW4q3ciUtFL96FukZeLV7i4XxB8KNAv3fzKJzS-2BDxNFBjn2xC6-2BKkIPOsVmkAbAnM9LWd6QXm5b1Xk3bWbDUHPpDswdmiMuqBo4WPmEZsqf6IAkGg33j6OxJyVG-2FFBAYt5Blvn1QfSZq3HXobs1zvidL-2BkY0Xyp-2BYZl2QOOnnXX3WdnK3xtkZRZwWqaf1rLjMeD06CnUSNU-2FlKf-2B39e0Z5vWn-2BwXHWDw6b3G-2FbhAomzWtsIC9J2qdiqQ-2Btnow4qaraacurUUcolucfqc> ArcGIS
Online "Layer did not draw completely" message?
reply from Mike Minami
<http://jiveon.jivesoftware.com/wf/click?upn=Dg1s4x8le7Lmxv8KWGaqo7A4BXwO9PY1WvQ5cXCtK4-2BSzaYAWbep1g7MeWcxXKCxYil2QP2ixsUiesw0zHBPVPx3wXvP76-2FW8JxYmmawimE-3D_bqT196RXALHHwSvsKam0FZ1Cs90ihnJY4fs9KfIu7T1OLYXxMW4q3ciUtFL96FukZeLV7i4XxB8KNAv3fzKJzS-2BDxNFBjn2xC6-2BKkIPOsVmkAbAnM9LWd6QXm5b1Xk3bE1q9GC2vjyBCe9Bo5wflGV6xstFg7KSESOUr05ZipV-2FFP4MOeaJUHkzFkly658qNkiEh8va047GrDbw8YXD6pTnWxgFKwRIbDh2lxVQ9hI-2BlJ3DQ1af-2B1qPJkj2ktS06Oog6Zsc0aWdpT-2FvDQV8-2BDk315xkvY5UTd2axaGWna0oEbBAaxLgrSISjPHCmVUal>
in ArcGIS Online - View the full discussion
<http://jiveon.jivesoftware.com/wf/click?upn=Dg1s4x8le7Lmxv8KWGaqo0VQjeJBYpG9HGC8QZBT-2FEyvgRqOPucVCgYONU23feMBugCzUcaX8SxjawoFXLwFzn-2BSDurG23F9Q9JjEEZAucw-3D_bqT196RXALHHwSvsKam0FZ1Cs90ihnJY4fs9KfIu7T1OLYXxMW4q3ciUtFL96FukZeLV7i4XxB8KNAv3fzKJzS-2BDxNFBjn2xC6-2BKkIPOsVmkAbAnM9LWd6QXm5b1Xk3b2RUz91amUTXP-2FJF2oJ-2FaIJHRnvB9j0oxHSsSABG82lC8YzFC1gJtVKZQOC4zmGkvHMuAMJC-2B-2FJN9Uu-2FIV1-2BKG8A2-2BKc2b1ONwDs2mU84B4rAxUTT3j3t7bruX6VXGtSJlrdPAsVH2Ux-2FXUTc1zPEvz4f4pqPmbGgJ2NMODxpWAkWIcKKg08tnry3h6XTcvjJ>