- Home
- :
- All Communities
- :
- Products
- :
- Mapping
- :
- Mapping Questions
- :
- multiple bar/column charts with negative values
- Subscribe to RSS Feed
- Mark Topic as New
- Mark Topic as Read
- Float this Topic for Current User
- Bookmark
- Subscribe
- Mute
- Printer Friendly Page
multiple bar/column charts with negative values
- Mark as New
- Bookmark
- Subscribe
- Mute
- Subscribe to RSS Feed
- Permalink
- Report Inappropriate Content
Dear all,
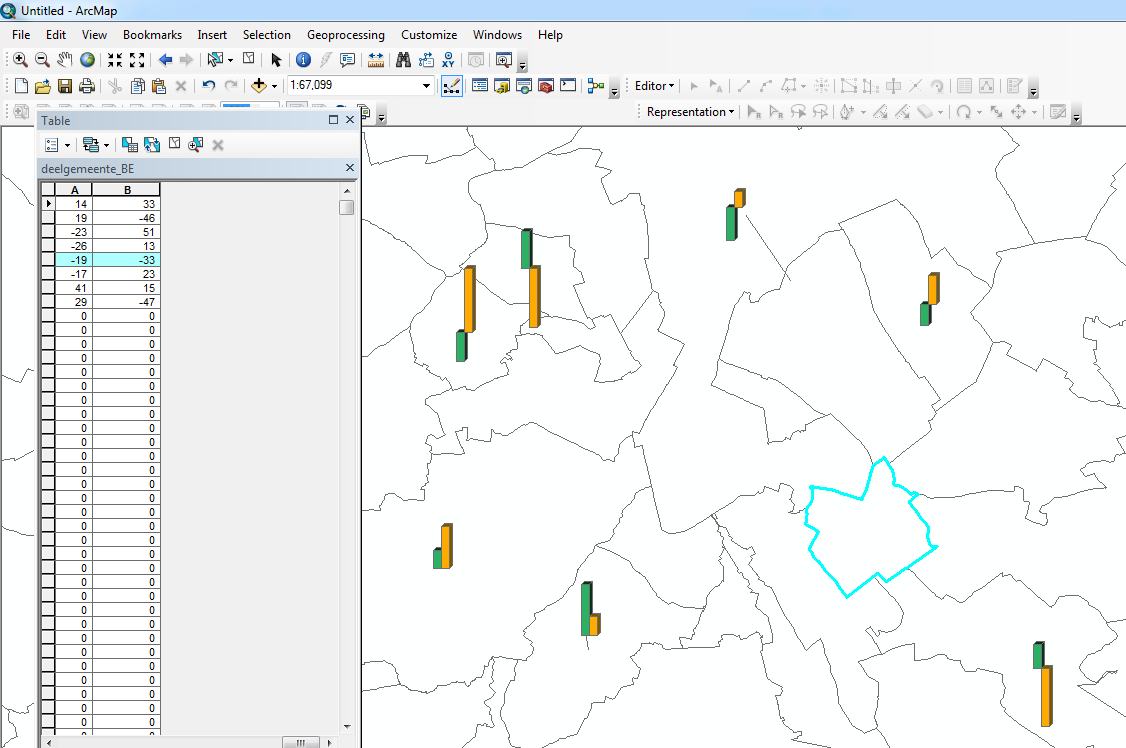
I encountered an annoying problem in ArcMap when using bar/column charts. When I use multiple bars/columns (2 bars/columns actually) and both represent negative values, no bars/columns appear on the map. However, when both values are positive or when I have one positive value and one negative value everything looks fine. I attached a screenshot to illustrate my problem. The selected feature has 2 negative values and no columns appear???
What can be the reason and how should I solve this problem?
Any help will be much appreciated!
Kind regards,
Philippe
- Mark as New
- Bookmark
- Subscribe
- Mute
- Subscribe to RSS Feed
- Permalink
- Report Inappropriate Content
interesting...have you tried putting in a 3rd variable/value with 0 or slightly positive to see if the behaviour is the same?
- Mark as New
- Bookmark
- Subscribe
- Mute
- Subscribe to RSS Feed
- Permalink
- Report Inappropriate Content
Hi Dan,
Yeah, I've tried your suggestion earlier. Indeed, when you add an extra field and populate this with low values close to zero (e.g. 0.001), and you add that field as a third bar/column on your map (with No Color for Outline Color and Fill Color), then everything looks fine. However, shouldn't there be a cleaner solution for this problem than this workaround?
Kind regards,
Philippe
- Mark as New
- Bookmark
- Subscribe
- Mute
- Subscribe to RSS Feed
- Permalink
- Report Inappropriate Content
Sure... but you will have to bring your particular case to tech support as an "enhancement request" or as we are more inclined to do "bug fix". In the interim, they will probably, just post the workaround until tech support evaluates how many people will need this "option" and whether there is enough demand to put the effort into addressing the problem. Cheers