- Home
- :
- All Communities
- :
- Products
- :
- Mapping and Charting Solutions
- :
- Mapping and Charting Questions
- :
- How do I create and display the row and column of ...
- Subscribe to RSS Feed
- Mark Topic as New
- Mark Topic as Read
- Float this Topic for Current User
- Bookmark
- Subscribe
- Mute
- Printer Friendly Page
How do I create and display the row and column of a hexagon grid
- Mark as New
- Bookmark
- Subscribe
- Mute
- Subscribe to RSS Feed
- Permalink
- Report Inappropriate Content
Hi,
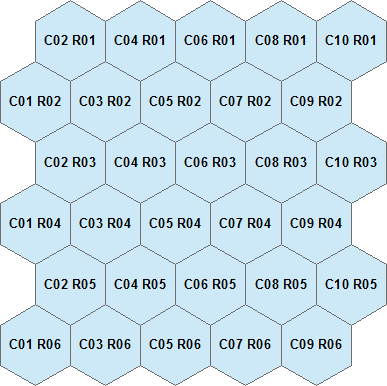
I'm trying to figure out how to make display coordinates of each hexagon in a hex array. The numbers are a combination of the row and column of the hexagon. The following is an example of what I'm trying to do:
Thanks!

- Mark as New
- Bookmark
- Subscribe
- Mute
- Subscribe to RSS Feed
- Permalink
- Report Inappropriate Content
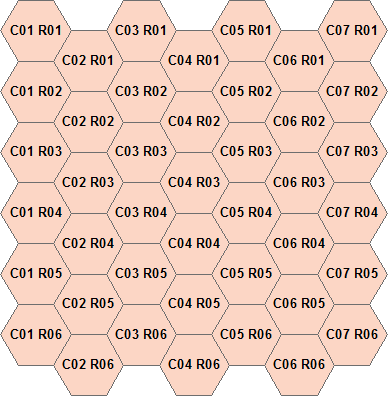
Oh dear, mmm, I guess I did something wrong here... I used some code to create hexagons and analyzed the rows and columns to create the labels, but my hexagons are oriented differently... Oops. This is my result (I added the R and C to show what value represents the row and which one the column):
The code I used is:
import math import arcpy import os # http://stackoverflow.com/questions/26691097/faster-way-to-calculate-hexagon-grid-coordinates def calc_polygons_new(startx, starty, endx, endy, radius): sl = (2 * radius) * math.tan(math.pi / 6) # calculate coordinates of the hexagon points p = sl * 0.5 b = sl * math.cos(math.radians(30)) w = b * 2 h = 2 * sl # offsets for moving along and up rows xoffset = b yoffset = 3 * p row = 1 shifted_xs = [] straight_xs = [] shifted_ys = [] straight_ys = [] while startx < endx: xs = [startx, startx, startx + b, startx + w, startx + w, startx + b, startx] straight_xs.append(xs) shifted_xs.append([xoffset + x for x in xs]) startx += w while starty < endy: ys = [starty + p, starty + (3 * p), starty + h, starty + (3 * p), starty + p, starty, starty + p] (straight_ys if row % 2 else shifted_ys).append(ys) starty += yoffset row += 1 polygons = [zip(xs, ys) for xs in shifted_xs for ys in shifted_ys] + [zip(xs, ys) for xs in straight_xs for ys in straight_ys] return polygons # create hexagons result = calc_polygons_new(0, 0, 10, 10, 1) cnt = 0 lst_x = [] lst_y = [] dct_hex = {} for hexa in result: lst = [] cnt += 1 for tpl in hexa: pnt = arcpy.Point(tpl[0], tpl[1]) lst.append(pnt) polygon = arcpy.Polygon(arcpy.Array(lst)) x = polygon.labelPoint.X y = polygon.labelPoint.Y lst_x.append(x) lst_y.append(y) dct_hex[cnt] = [polygon, x, y] # sort x and y label points lists lst_x = sorted(list(set(lst_x))) lst_y = sorted(list(set(lst_y))) # create column number col = 0 dct_x = {} for x in lst_x: col += 1 dct_x= col # create row number row = 0 dct_y = {} for y in reversed(lst_y): row += 1 dct_y= row # define label for cnt, lst in dct_hex.items(): x = lst[1] y = lst[2] row = dct_ycol = dct_x lbl = "C{0} R{1}".format("%02d" % (col,), "%02d" % (row,)) lst.append(lbl) dct_hex[cnt] = lst # create empty fc arcpy.env.overwriteOutput = True out_fc = r"C:\Forum\Hexagon\hexa03.shp" path, name = os.path.split(out_fc) arcpy.CreateFeatureclass_management(path, name, "POLYGON") # insert hexagons fld_lbl = "Label" arcpy.AddField_management(out_fc, fld_lbl, "TEXT", None, None, 10) flds = ("SHAPE@", fld_lbl) with arcpy.da.InsertCursor(out_fc, flds) as curs: for cnt, lst in dct_hex.items(): row = (lst[0], lst[3],) curs.insertRow(row)
I'm gonna dive into this again and generate the hexagons like you show in the image.
- Mark as New
- Bookmark
- Subscribe
- Mute
- Subscribe to RSS Feed
- Permalink
- Report Inappropriate Content
Xander there are two representations of hexagons...pointy-headed and flat-headed (and they aren't my terms). I document both on my blog:
Numpy Snippets # 3 ... Phish_Nyet ... creating sampling grids using numpy and arcpy and
NumPy Snippets # 4... N-gons... Regular polygonal shape generation .
One of them has some code for numbering but it is different than the method you used, to give some options.
So pick your type and number accordingly.
- Mark as New
- Bookmark
- Subscribe
- Mute
- Subscribe to RSS Feed
- Permalink
- Report Inappropriate Content
Hi Dan Patterson , thanks for reminding me of what numpy is capable. Great links!
- Mark as New
- Bookmark
- Subscribe
- Mute
- Subscribe to RSS Feed
- Permalink
- Report Inappropriate Content
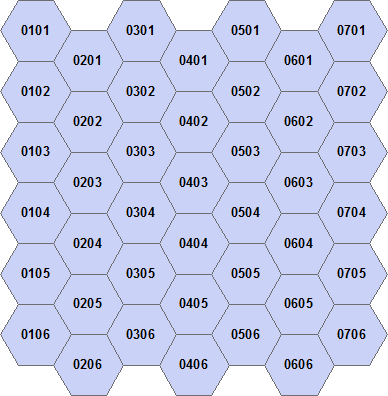
Okay, a second test looks like this:
... and applying the label format from your example:
The code I used for this was:
import math
import arcpy
import os

def generate_hexagons(startx, starty, endx, endy, radius):
    hex_h = math.sin(math.radians(60)) * radius * 2
    hex_w = radius + math.cos(math.radians(60)) * radius
    cols = int(math.ceil((endx - startx) / hex_w))
    rows = int(math.ceil((endy - starty) / hex_h))
    dct = {}
    cnt = 0
    for col in range(cols):
        for row in range(rows):
            cnt += 1
            x = startx + (col * hex_w)
            y = endy - (row * hex_h)
            m = col % 2 == 1
            polygon = create_hexagon(x, y, radius, m)
            dct[cnt] = [polygon, col+1, row+1]
    return dct

def create_hexagon(x, y, radius, shift):
    lst = []
    shift_y = -1 * (math.sin(math.radians(60)) * radius) if shift else 0
    for a in range(7):
        angle = a * 60
        lst.append(arcpy.Point(x + math.cos(math.radians(angle)) * radius, y + math.sin(math.radians(angle)) * radius + shift_y))
    return arcpy.Polygon(arcpy.Array(lst))

# create empty fc
arcpy.env.overwriteOutput = True
out_fc = r"C:\Forum\Hexagon\hexa2v05.shp"
path, name = os.path.split(out_fc)
arcpy.CreateFeatureclass_management(path, name, "POLYGON")

# generate the hexagons from 0,0 to 10,10 with a radius of 1
dct = generate_hexagons(0, 0, 10, 10, 1)

# write the hexagons to a fc
fld_lbl = "Label"
arcpy.AddField_management(out_fc, fld_lbl, "TEXT", None, None, 10)
flds = ("SHAPE@", fld_lbl)
with arcpy.da.InsertCursor(out_fc, flds) as curs:
    for cnt, lst in dct.items():
        polygon = lst[0]
        col = lst[1]
        row = lst[2]
        # lbl = "C{0} R{1}".format("%02d" % (col,), "%02d" % (row,))
        lbl = "{0}{1}".format("%02d" % (col,), "%02d" % (row,))
        row = (polygon, lbl,)
        curs.insertRow(row)
If you have any questions let me know.
Kind regards, Xander
- Mark as New
- Bookmark
- Subscribe
- Mute
- Subscribe to RSS Feed
- Permalink
- Report Inappropriate Content
... and if you want to use the cloud: Creating thematic maps with hexagons in ArcGIS Online | ArcGIS Blog
- Mark as New
- Bookmark
- Subscribe
- Mute
- Subscribe to RSS Feed
- Permalink
- Report Inappropriate Content
Nice!!! Hexagons are where its at 