- Home
- :
- All Communities
- :
- Products
- :
- 3D
- :
- 3D Questions
- :
- Convert 3D points to 3D lines (elevation data and ...
- Subscribe to RSS Feed
- Mark Topic as New
- Mark Topic as Read
- Float this Topic for Current User
- Bookmark
- Subscribe
- Mute
- Printer Friendly Page
Convert 3D points to 3D lines (elevation data and river cross sections)
- Mark as New
- Bookmark
- Subscribe
- Mute
- Subscribe to RSS Feed
- Permalink
- Report Inappropriate Content
Dear Xander and others,
I am very interested by your topic. I am also trying to convert 3D points into 3D lines. The data is elevation points on river cross sections. I tried this procedure based on standard tools:
1) “Split Line At Point”: lines = cross sections; points = elevation surveys
2) “Spatial Join”: target features = split segments; join features = elevation surveys, to match point attributes (Z, order of the points, etc) with split segments
3) “Feature To 3D By Attribute” on join split segments
4) “Dissolve”: aggregate split segments based on cross section IDs
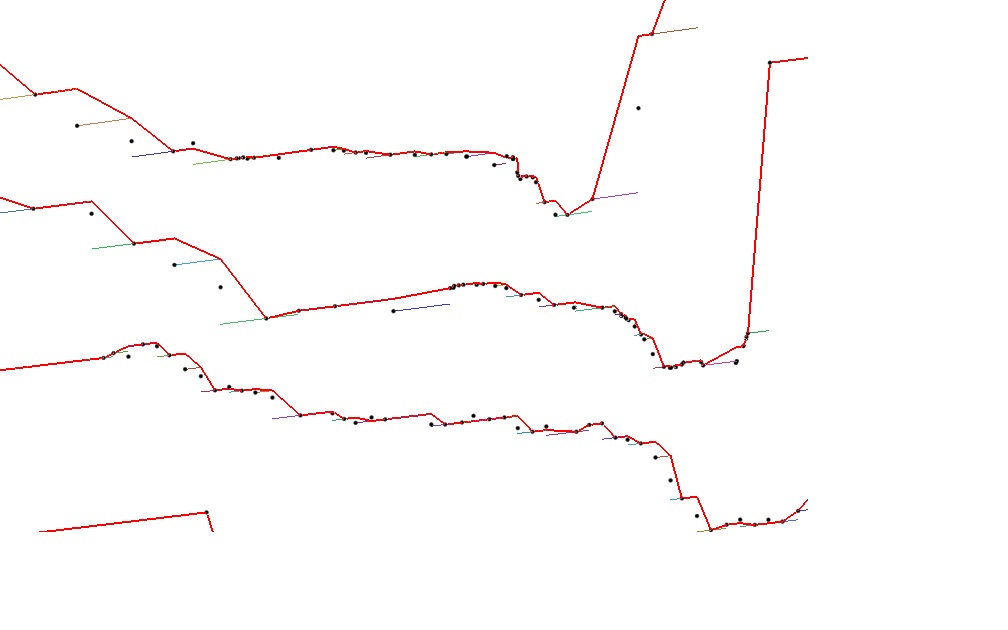
This procedure does not work well. “Split Line at Point” fails to take points spaced of a few centimeters. However it is not a major problem since it can permit to smooth elevation points. The main problem is “Spatial Join” does not match correctly segments with points: most of the time the same point attribute is given to two successive segments surrounding the point, so that approximately half the point information of the data set is missing. Finally the dissolved lines do not align with points. See the ArcScene capture: colored segments are join split segments, red lines are dissolved lines, and black points are elevation surveys.
So I would be very interested by using your Python code! However I am a very (very) beginner of Python and I am not sure how to use it. It tried to adjust the code:
But I get error messages. Please could you provide me assistance?
Thank you in advance for your reply.
- Mark as New
- Bookmark
- Subscribe
- Mute
- Subscribe to RSS Feed
- Permalink
- Report Inappropriate Content
Hi Timothy Hales, can you branch this question into a new discussion (question) or upgrade my permissions to the other places too? Thanks!
Hi fanny arnaud , I will ask Timothy to branch this to a new question, since I don't have rights to do this. When you include code could you please follow the instructions in this Posting Code blocks in the new GeoNet . This way the code can be copied and used. Is it also possible to attach some sample data? This allows me (and others) to more efficiently adapt the code and/or advise you.
Kind regards, Xander
Edit: the thread with the original code is located here: Convert 3D points to 3D lines (underground well data)
- Mark as New
- Bookmark
- Subscribe
- Mute
- Subscribe to RSS Feed
- Permalink
- Report Inappropriate Content
Xander Bakker and fanny arnaud I have branched this reply to a new discussion.
- Mark as New
- Bookmark
- Subscribe
- Mute
- Subscribe to RSS Feed
- Permalink
- Report Inappropriate Content
Some first comments:
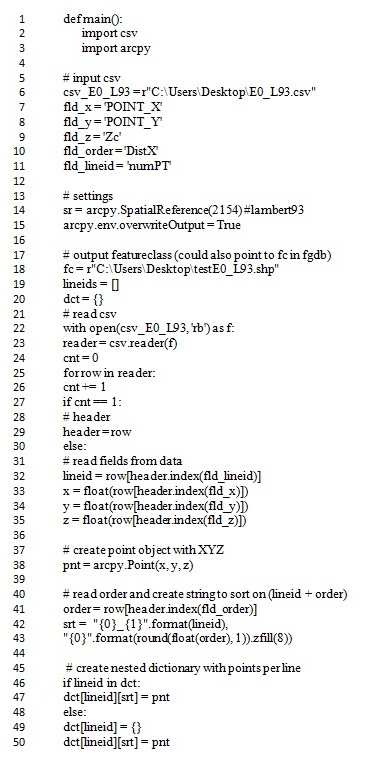
- the image does not show all lines (lines 52 - 65 are missing)
- on line 42, you have a closing bracket after "lineid" which should be removed (it is causing an incorrect syntax).
def main():
    import csv
    import arcpy

    # input csv
    csv_path = r"C:\Users\Desktop\E0_L93.csv"
    fld_x = 'POINT_X'
    fld_y = 'POINT_Y'
    fld_z = 'Zc'
    fld_order = 'DistX'
    fld_lineid = 'numPT'

    # settings
    sr = arcpy.SpatialReference(2154) # lambert93
    arcpy.env.overwriteOutput = True

    # output featureclass (could also point to fc in fgdb)
    fc = r"C:\Users\Desktop\testE0_L93.shp"
    lineids = []
    dct = {}
    # read csv
    with open(csv_path, 'rb') as f:
        reader = csv.reader(f)
        cnt = 0
        for row in reader:
            cnt += 1
            if cnt == 1:
                # header
                header = row
            else:
                # read fields from data
                lineid = row[header.index(fld_lineid)]
                x = float(row[header.index(fld_x)])
                y = float(row[header.index(fld_y)])
                z = float(row[header.index(fld_z)])

                # create point object with XYZ
                pnt = arcpy.Point(x, y, z)

                # read order and create string to sort on (lineid + order)
                order = row[header.index(fld_order)]
                srt = "{0}_{1}".format(lineid,
                      "{0}".format(round(float(order), 1)).zfill(8))

                # create nested dictionary with points per line
                if lineid in dct:
                    dct[lineid][srt] = pnt
                else:
                    dct[lineid] = {}
                    dct[lineid][srt] = pnt

    # create polylines
    lst_polylines = []
    for lineid, dct2 in dct.items():
        lst_pnt = []
        for srt, pnt in sorted(dct2.items()):
            lst_pnt.append(pnt)
        polyline = arcpy.Polyline(arcpy.Array(lst_pnt), sr, True, False)
        lst_polylines.append(polyline)

    # write polylines to output featureclass
    arcpy.CopyFeatures_management(lst_polylines, fc)

if __name__ == '__main__':
    main()
However, I don't know if this will work with your data...
- Mark as New
- Bookmark
- Subscribe
- Mute
- Subscribe to RSS Feed
- Permalink
- Report Inappropriate Content
- Mark as New
- Bookmark
- Subscribe
- Mute
- Subscribe to RSS Feed
- Permalink
- Report Inappropriate Content
It seems that your csv file contains a semi colon as field separator and a comma as decimal sign. I changed it to the standard comma as field separator and point as decimal sign and it seems to work:

I will attach the resulting files to the thread. The code is the same (although I am reading a copy of the csv file). I have attached the code as .py file.
- Mark as New
- Bookmark
- Subscribe
- Mute
- Subscribe to RSS Feed
- Permalink
- Report Inappropriate Content
great! the code works well with the standard csv format. Thank you very much.
Actually 3D lines are the first step of a procedure to create bathymetry mesh from cross sections (V. Merwade's tool). At the moment I have to solve installation bugs on a downgraded version of ArcGIS but I hope the tool will work well.
Thank you again for helping me with your code.