- Home
- :
- All Communities
- :
- Products
- :
- ArcGIS Dashboards
- :
- ArcGIS Dashboards Questions
- :
- Using Related Tables in Operations Dashboard
- Subscribe to RSS Feed
- Mark Topic as New
- Mark Topic as Read
- Float this Topic for Current User
- Bookmark
- Subscribe
- Mute
- Printer Friendly Page
Using Related Tables in Operations Dashboard
- Mark as New
- Bookmark
- Subscribe
- Mute
- Subscribe to RSS Feed
- Permalink
- Report Inappropriate Content
A lot of people have questions on how to leverage data from related tables using Operations Dashboard for ArcGIS. These tables can be used as data sources and this video takes you through how to set up a Dashboard using some sample data with related tables.
- Mark as New
- Bookmark
- Subscribe
- Mute
- Subscribe to RSS Feed
- Permalink
- Report Inappropriate Content
This is great stuff!!
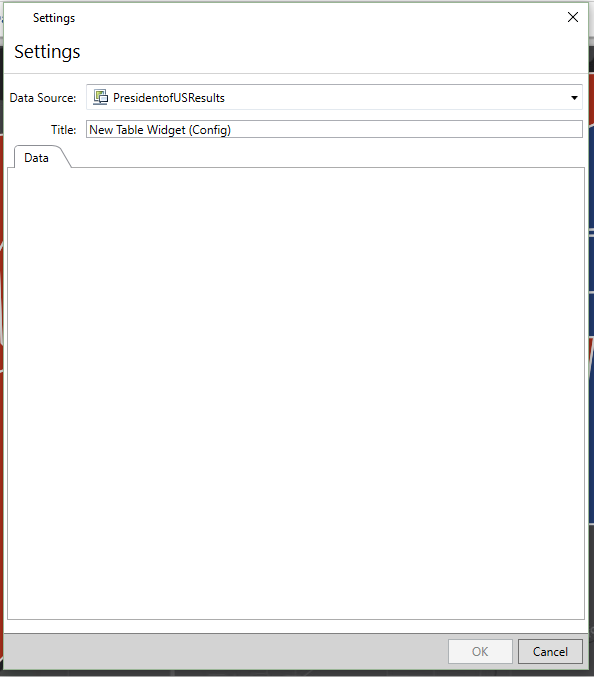
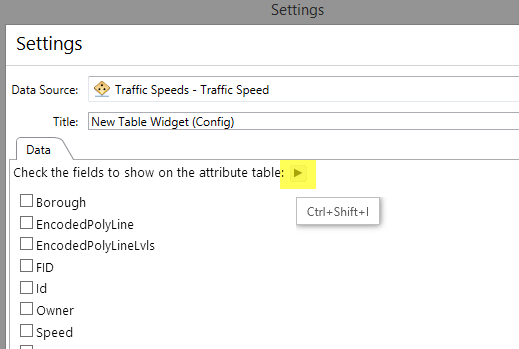
Any ideas why no attribute configuration info appears when I add the widget? This is what it leaves me with.
- Mark as New
- Bookmark
- Subscribe
- Mute
- Subscribe to RSS Feed
- Permalink
- Report Inappropriate Content
Can you debug using the HTML debugger?
- Mark as New
- Bookmark
- Subscribe
- Mute
- Subscribe to RSS Feed
- Permalink
- Report Inappropriate Content
Nice job on the video, well explained. Still, it feels like a "workaround" because the user has to type in the ID for the separate query. We always have to wait for related table support to be a natural out-of-the-box feature.
- Mark as New
- Bookmark
- Subscribe
- Mute
- Subscribe to RSS Feed
- Permalink
- Report Inappropriate Content
Yup, I completely agree Ted. It's a workaround but I think so many people think that you can't use the tables at all in Ops Dashboard, and that's a myth. So hopefully they can use the workaround to show the data, until we get the better solution in place.
- Mark as New
- Bookmark
- Subscribe
- Mute
- Subscribe to RSS Feed
- Permalink
- Report Inappropriate Content
I connect my feature table and related table using a GUID. The idea of my field workers typing in a GUID to see the history of hydrant inspections makes this a nonstarter. Honestly having them type in anything is going to be a horrible user experience and I won't implement it. I understand this is beta software but not supporting related tables will make Dashboard appear half baked IMO.
- Mark as New
- Bookmark
- Subscribe
- Mute
- Subscribe to RSS Feed
- Permalink
- Report Inappropriate Content
colsen-esristaff, I also appreciate this video, but strongly agree that full support of related records and their attachments needs to be supported in Dashboard. When can we expect to see this? I see online posts stemming back to 2013 to support this functionality. ESRI reps responded to those posts, and promises were made to the user community of related record support in upcoming releases, so we know this request made it's way back to the developers.
Dashboard is supposed to be complimentary software to http://learn.arcgis.com/en/projects/manage-a-mobile-workforce/Collector, no? At the point that the demo on how to Manage a Mobile Workforce | Learn ArcGIS was released in 2015, a similar solution should have been in the works for the next release of Dashboard. Not trying to be harsh, but the clock has been ticking for a long time. This support needs to happen in order for us to truly leverage the resources available in Dashboard. I agree with @Thomas Hasselbeck, we won't be deploying Dashboard with "work arounds" that aren't complete, user-friendly solutions.
Please respond with ESRI's timeline for related record, attachments included, widget functionality in Dashboard.
- Mark as New
- Bookmark
- Subscribe
- Mute
- Subscribe to RSS Feed
- Permalink
- Report Inappropriate Content
This feels awkward and clunky. the related records no longer seem "related" in the map. it's just an external table that has been brought in with search functionality & widget configurability.
Related records work in ArcGIS online, you'd think they'd transfer to the dashboard.
Any updated on this?
- Mark as New
- Bookmark
- Subscribe
- Mute
- Subscribe to RSS Feed
- Permalink
- Report Inappropriate Content
I have the same question. The data are not related anymore. did you find any solution or trick for this ?
- Mark as New
- Bookmark
- Subscribe
- Mute
- Subscribe to RSS Feed
- Permalink
- Report Inappropriate Content
Hi all,
Using the second-generation Operations Dashboard, we can now configure the visual elements in a dashboard to show and interact with related records.
To illustrate how it works, we prepared this dashboard which contains a hydrant layer and its inspection records. When a hydrant on the list at the top is selected, the list at the bottom will be updated to show the last 10 inspections of that hydrant. You can also click on an inspection record to see its detail.
The relationship/wiring between these visual elements was setup in the Actions menu of the “source” element (the hydrant list in this case). The screenshot below shows how the hydrant list was configured to update the inspection list: First, a “Filter” action was setup on the hydrant list, so that when a list item is selected, the list will use the “common field” (Facility ID) to wire up itself with the “target” element (Inspections List).

If you want to see how the configuration was made, you can make a copy of the dashboard by clicking on the following URL: http://www.arcgis.com/apps/opsdashboard/index.html#/new?id=5294afb250b942698f71cdebafb531dc, it will save a copy of the dashboard into your org under your account. You can then open the Actions menu of the Hydrant List to see the configuration.
If you have specific requirements that our current action framework cannot satisfy, or if you have ideas on how we can make the action framework better, please let us know your thoughts.
Thanks!
Tif