- Home
- :
- All Communities
- :
- Products
- :
- Spatial Data Science
- :
- Spatial Data Science Questions
- :
- average of ice edge lines (distance from coast)
- Subscribe to RSS Feed
- Mark Topic as New
- Mark Topic as Read
- Float this Topic for Current User
- Bookmark
- Subscribe
- Mute
- Printer Friendly Page
average of ice edge lines (distance from coast)
- Mark as New
- Bookmark
- Subscribe
- Mute
- Subscribe to RSS Feed
- Permalink
- Report Inappropriate Content
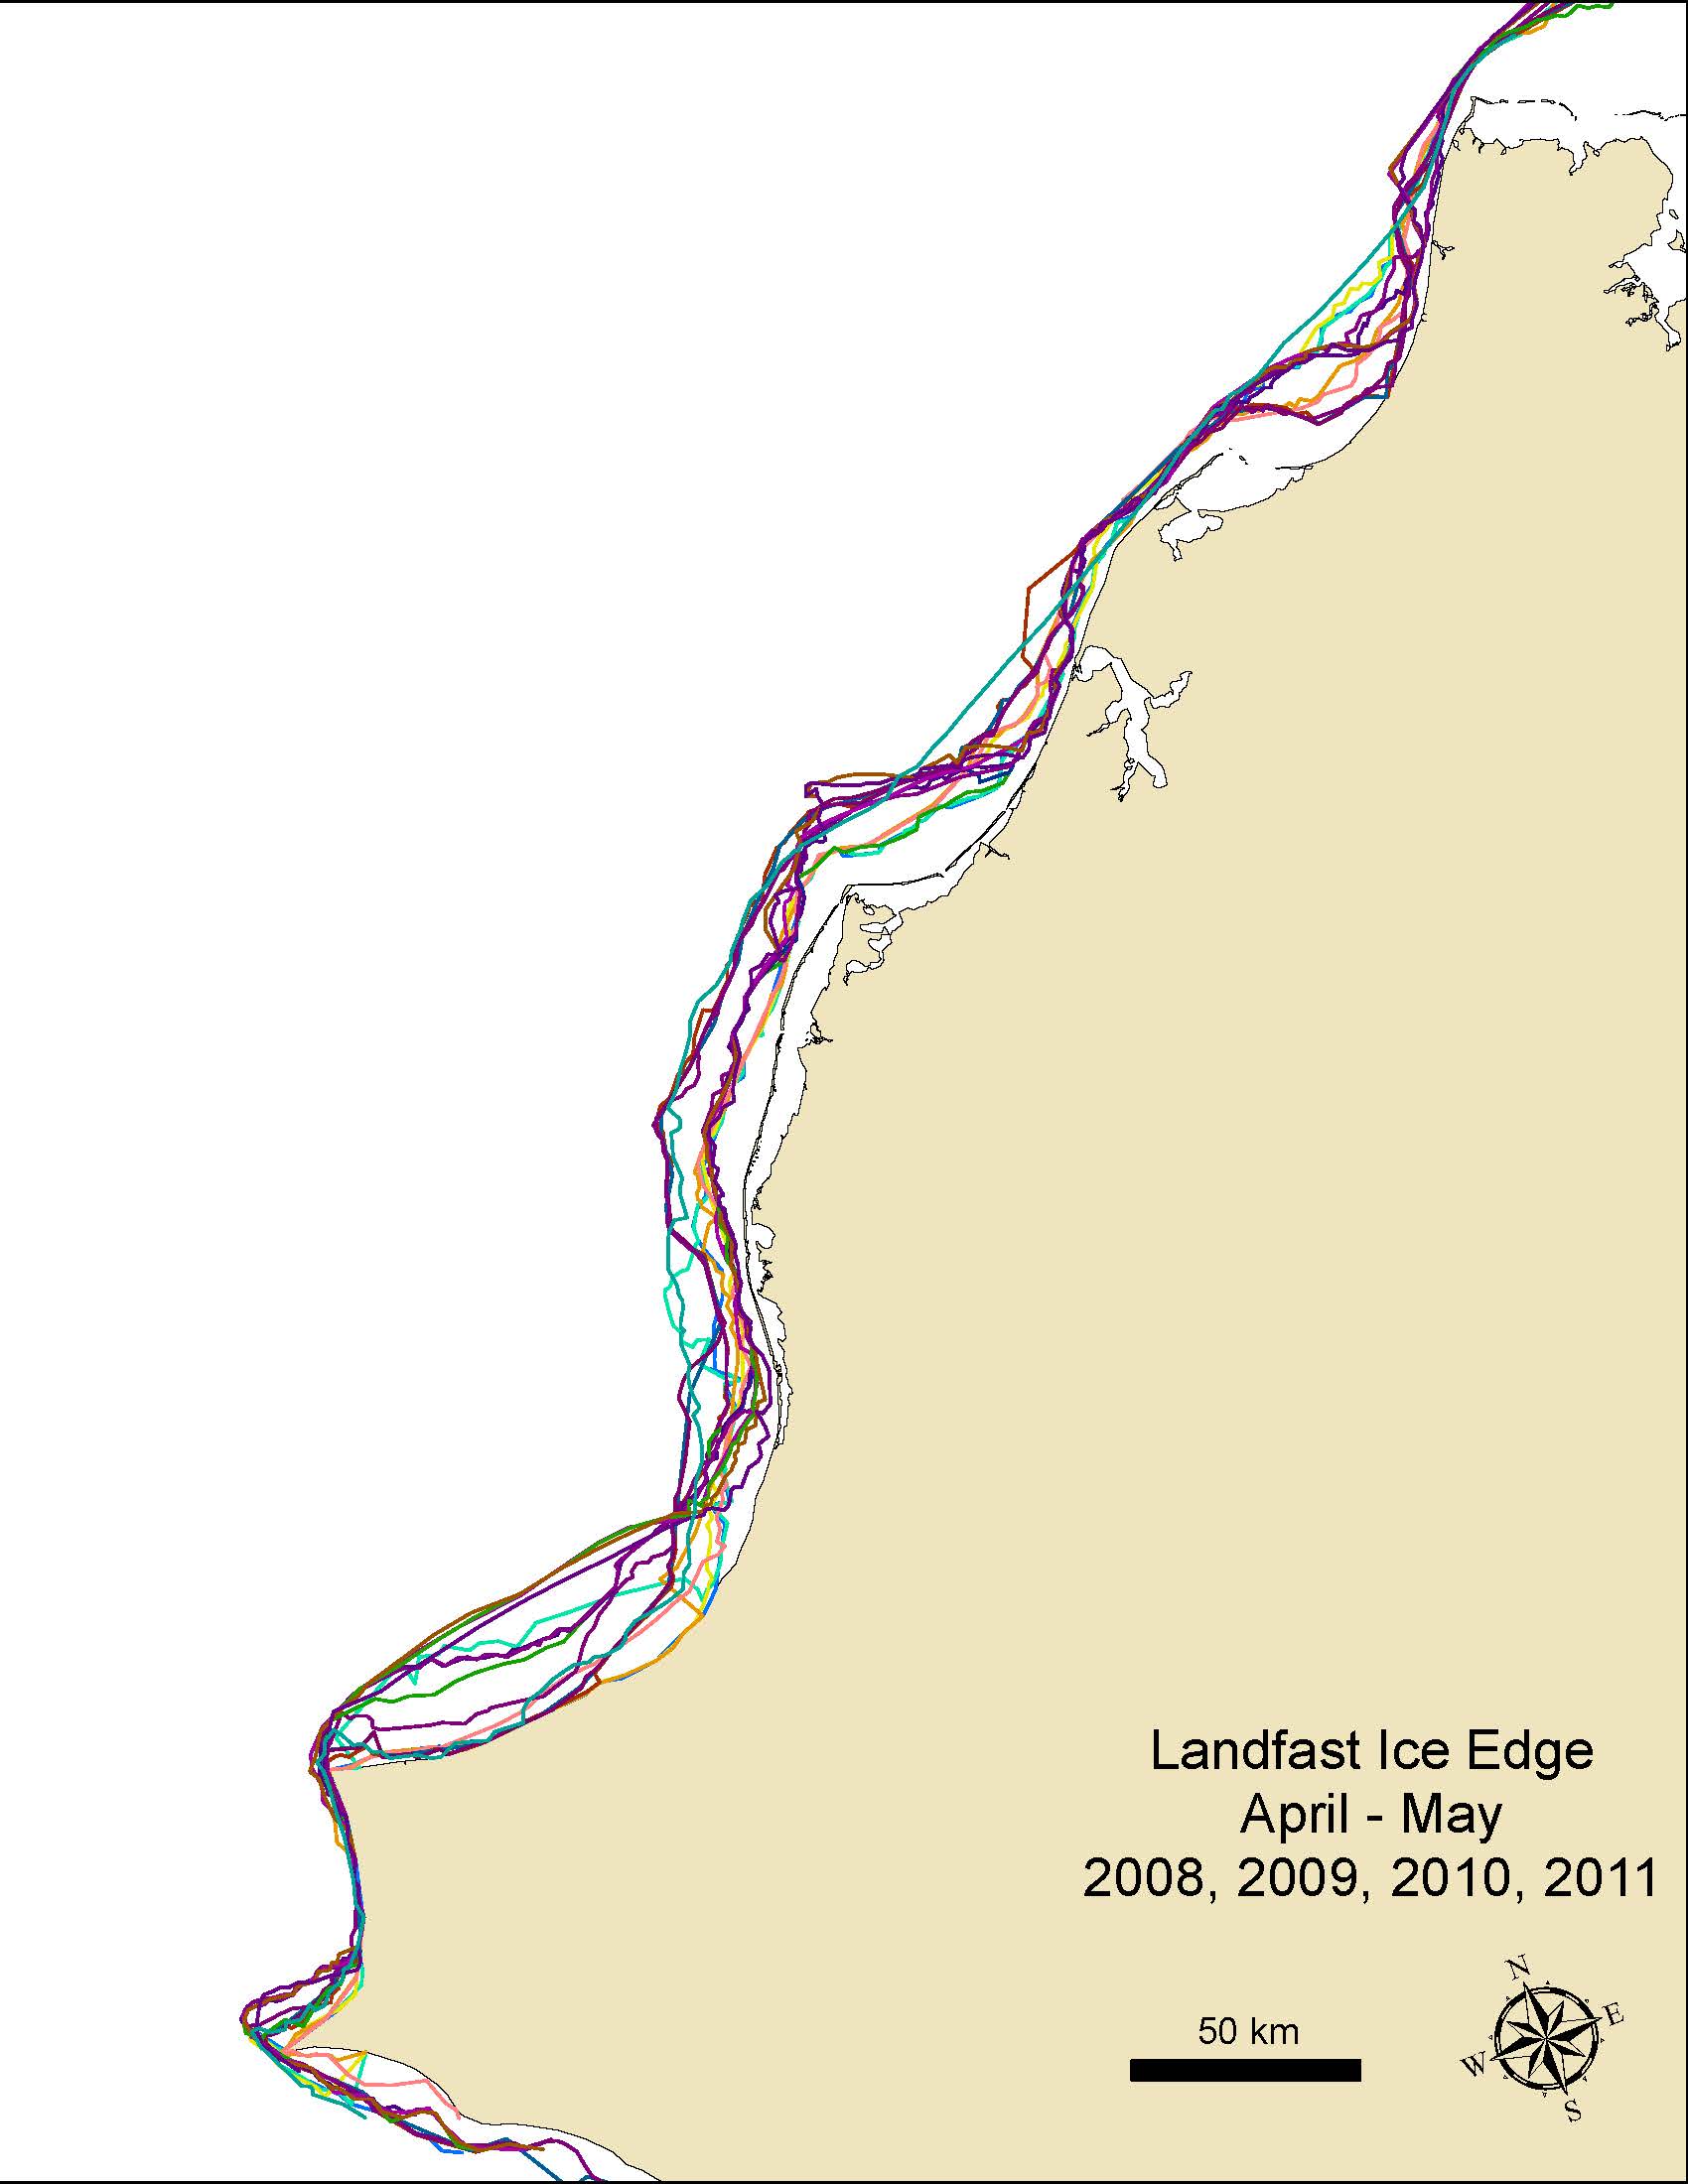
I have developed landfast sea ice extents that can be visualized as polygons, lines or rasters. Now I need to calculate monthly and yearly averages and it is much more difficult to create an average line from a set of polylines than I had imagined.
I first tried to use raster world and the Euclidean Distance tools to determine the distance from shore, but since the ice lines and the shoreline are so complex I needed a way to measure the distance from the same point on land or the averages are meaningless.
so, I developed a set of tangent lines and intersected them with my ice edge lines to get a set of points. I have been able to use spatial join to get the distances from shore and then add field and field calculator to get average distances along each of my tangent lines.
My plan is to then plot the average distances for each tangent line as a point and then connect the points to show the 'average' of my original ice edge lines for each month and year.
I think that I need to use linear referencing tools to get past this latest hurdle, so I created routes from my set of tangent lines. Now I need to create points that are my 'average distance' from shore but I am at a loss. I have minimal experience scripting and would appreciate help using the geoprocessing tools in modelbuilder.
Thanks,
Aariel
Solved! Go to Solution.
Accepted Solutions
- Mark as New
- Bookmark
- Subscribe
- Mute
- Subscribe to RSS Feed
- Permalink
- Report Inappropriate Content
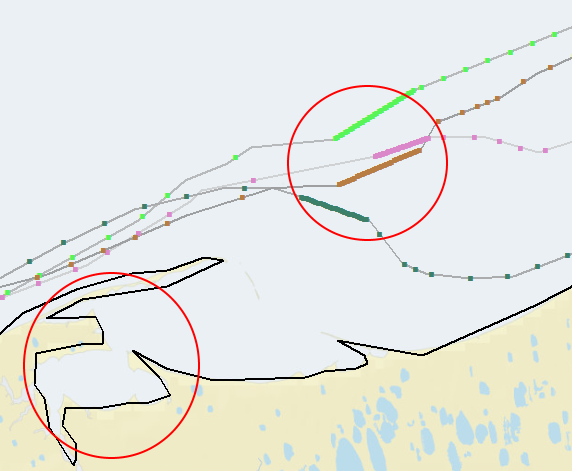
OK, I gave it a shot and this is what I got so far...
I took a random part of the globe:
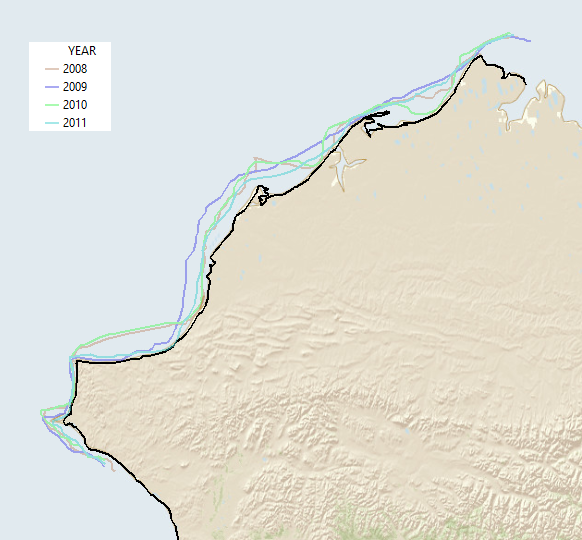
... OK, I admit I georeferenced the image that was attached. 
Digitized the coast line, and 4 ice edges (no to mucho detail) and started coding.
The process consists of the following steps:
- get the coast line polyline
- create a featureclass to store the routes (ice edges where each vertice has a m-value representing the relative position on the coast line)
- loop through the ice edges and fill the m-enabled featureclass with the ice edge routes
- create a table with events and fill with YEAR values and M values
- execute MakeRouteEventLayer_lr to generate a layer with point events based on the ice edge routes and the event table
- create a nested dictionary with the event points and relevant information
- get min, max and mean statistics from the nested dictionary
- ... generate polylines and write the resulting geometries and statistics to the output featureclass
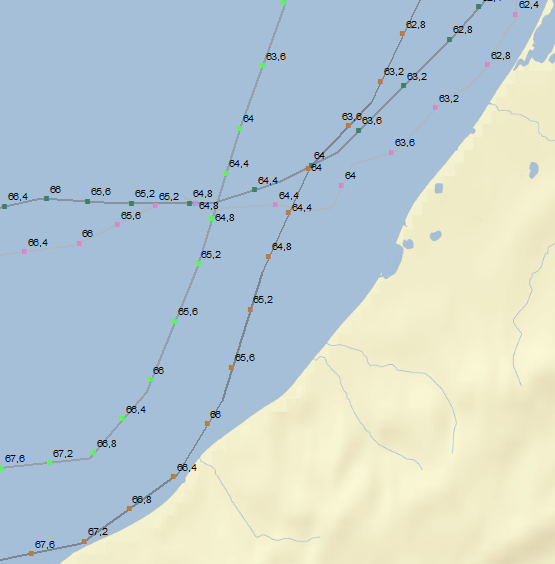
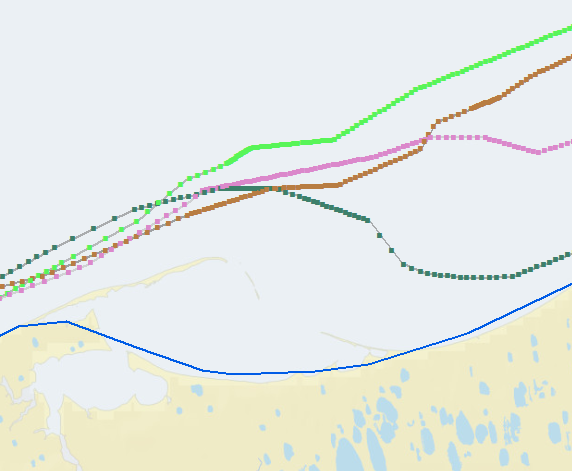
Example area showing the ice edges with the event points created on the lines with the m value (the relative position on the coast line).
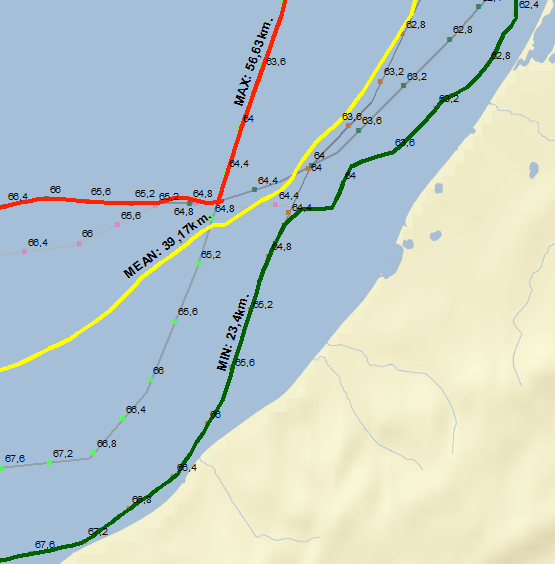
... and the resulting MIN, MAX and MEAN lines (comparing the event points on the ice edge lines based on the m-values and distance to the coast line) :
Code used:
import arcpy
def main():
import os
# input and output featureclasses
# fc_coast = r'D:\Xander\GeoNet\IceEdges\data.gdb\coast'
fc_coast = r'D:\Xander\GeoNet\IceEdges\data.gdb\coast_simple'
fc_ice = r'D:\Xander\GeoNet\IceEdges\data.gdb\ice_edges'
fld_id = 'YEAR' # should be unique long
fld_stats = 'Stats'
fld_dist = 'Distance'
fld_m_value = 'M_Value'
fld_loc_err = 'LOC_ERROR'
fc_routes = r'D:\Xander\GeoNet\IceEdges\data.gdb\routes_v04'
tbl_events = r'D:\Xander\GeoNet\IceEdges\data.gdb\tbl_events_v04'
fc_events = r'D:\Xander\GeoNet\IceEdges\data.gdb\events_v04'
fc_res = r'D:\Xander\GeoNet\IceEdges\data.gdb\result_v04'
# settings
ws, fc_name = os.path.split(fc_routes)
arcpy.env.workspace = ws
arcpy.env.overwriteOutput = True
steps = 1000
# get the coast line (asume first feature in coast fc)
coast_line = arcpy.da.SearchCursor(fc_coast,('SHAPE@')).next()[0]
# create output polyline zm featureclass
sr = arcpy.Describe(fc_coast).spatialReference
arcpy.CreateFeatureclass_management(ws, fc_name, "POLYLINE", None, "ENABLED", "DISABLED", sr)
# add field
arcpy.AddField_management(fc_routes, fld_id, "LONG")
# loop through ice edges and create dct with polyline m values
dct_polyline_m = {}
with arcpy.da.SearchCursor(fc_ice,('SHAPE@', fld_id)) as curs:
for row in curs:
year = row[1]
polyline_ice = row[0]
lst = []
for part in polyline_ice:
for pnt in part:
pntg_ice = arcpy.PointGeometry(pnt, sr)
pntg_on_line, m_value_coast, dist_to_coast, right_side = coast_line.queryPointAndDistance(pntg_ice, True)
pnt_m = arcpy.Point(pnt.X, pnt.Y, None, m_value_coast * 100.0)
lst.append(pnt_m)
polyline_m = arcpy.Polyline(arcpy.Array(lst), sr)
dct_polyline_m[year] = polyline_m
# create routes featureclass
with arcpy.da.InsertCursor(fc_routes, ('SHAPE@', fld_id)) as curs:
for year, polyline_m in dct_polyline_m.items():
curs.insertRow((polyline_m, year, ))
# create table with events
ws, tbl_name = os.path.split(tbl_events)
arcpy.CreateTable_management(ws, tbl_name)
arcpy.AddField_management(tbl_name, fld_id, "LONG")
arcpy.AddField_management(tbl_name, fld_m_value, "DOUBLE")
# get list of ID's (years)
lst_ids = sorted(list(set([r[0] for r in arcpy.da.SearchCursor(fc_ice, (fld_id))])))
# fill events table
with arcpy.da.InsertCursor(tbl_events, (fld_id, fld_m_value)) as curs:
for step in range(steps + 1):
m = float(step) / float(steps) * 100.0
for y in lst_ids:
curs.insertRow((y, m, ))
# create de route events
event_props = "{0} POINT {1}".format(fld_id, fld_m_value)
arcpy.MakeRouteEventLayer_lr(in_routes=fc_routes, route_id_field=fld_id,
in_table=tbl_events,
in_event_properties=event_props,
out_layer="EventPoints", offset_field="",
add_error_field="ERROR_FIELD",
add_angle_field="NO_ANGLE_FIELD",
angle_type="NORMAL",
complement_angle="ANGLE",
offset_direction="LEFT",
point_event_type="POINT")
# write the events to a fc
arcpy.CopyFeatures_management("EventPoints", fc_events)
# generate nested dct with event points and distance to coast (only no error events)
where = "{0} = 'NO ERROR'".format(arcpy.AddFieldDelimiters(fc_events, fld_loc_err))
dct_all = {}
lst_m = []
with arcpy.da.SearchCursor(fc_events,
('SHAPE@', fld_id, fld_m_value),
where_clause=where) as curs:
for row in curs:
pntg = row[0]
y = row[1]
m = row[2]
lst_m.append(m)
d = pntg.distanceTo(coast_line)
if m in dct_all:
dct = dct_all = [pntg, d]
dct_all = dct
else:
dct = {y: [pntg, d]}
dct_all = dct
# create list of m values
lst_m = sorted(list(set(lst_m)))
# stats
lst_min, dist_min = getStatPointsFromDct(dct_all, lst_m, lst_ids, "MIN")
lst_max, dist_max = getStatPointsFromDct(dct_all, lst_m, lst_ids, "MAX")
lst_mean, dist_mean = getStatPointsFromDct(dct_all, lst_m, lst_ids, "MEAN")
# create output fc for result
ws, fc_name = os.path.split(fc_res)
arcpy.CreateFeatureclass_management(ws, fc_name, "POLYLINE", None, "ENABLED", "DISABLED", sr)
# add fields to result fc
arcpy.AddField_management(fc_res, fld_stats, "TEXT", None, None, 25)
arcpy.AddField_management(fc_res, fld_dist, "DOUBLE")
# write results to output featureclass
with arcpy.da.InsertCursor(fc_res, ('SHAPE@', fld_stats, fld_dist)) as curs:
# MIN:
polyline = arcpy.Polyline(arcpy.Array(lst_min), sr)
curs.insertRow((polyline, "MIN", dist_min, ))
# MAX:
polyline = arcpy.Polyline(arcpy.Array(lst_max), sr)
curs.insertRow((polyline, "MAX", dist_max, ))
# MEAN:
polyline = arcpy.Polyline(arcpy.Array(lst_mean), sr)
curs.insertRow((polyline, "MEAN", dist_mean, ))
def getStatPointsFromDct(dct_all, lst_m, lst_ids, stat):
lst_polyline = []
lst_dist = []
for m in lst_m:
if m in dct_all:
dct = dct_allAt second intent I simplified the cost line (less detail, since the more detail and strange forms it has, the bigger the effect on erroneous distribution of the events over the edge lines:
after the simplification of the coast line (with a higher step setting):
- Mark as New
- Bookmark
- Subscribe
- Mute
- Subscribe to RSS Feed
- Permalink
- Report Inappropriate Content
Now you did say you had lines radiating out to those lines... just a thought Splitting lines at a specified distance or percentage—Help | ArcGIS for Desktop
- Mark as New
- Bookmark
- Subscribe
- Mute
- Subscribe to RSS Feed
- Permalink
- Report Inappropriate Content
Thanks for the response Dan.
I have already split my tangent lines at the intersections with each of my ice edge lines. That is how I got the lengths (=distance from shore) for each date that I needed to get the average distances.
Now I need to get the endpoints from lines that are the average distance from shore.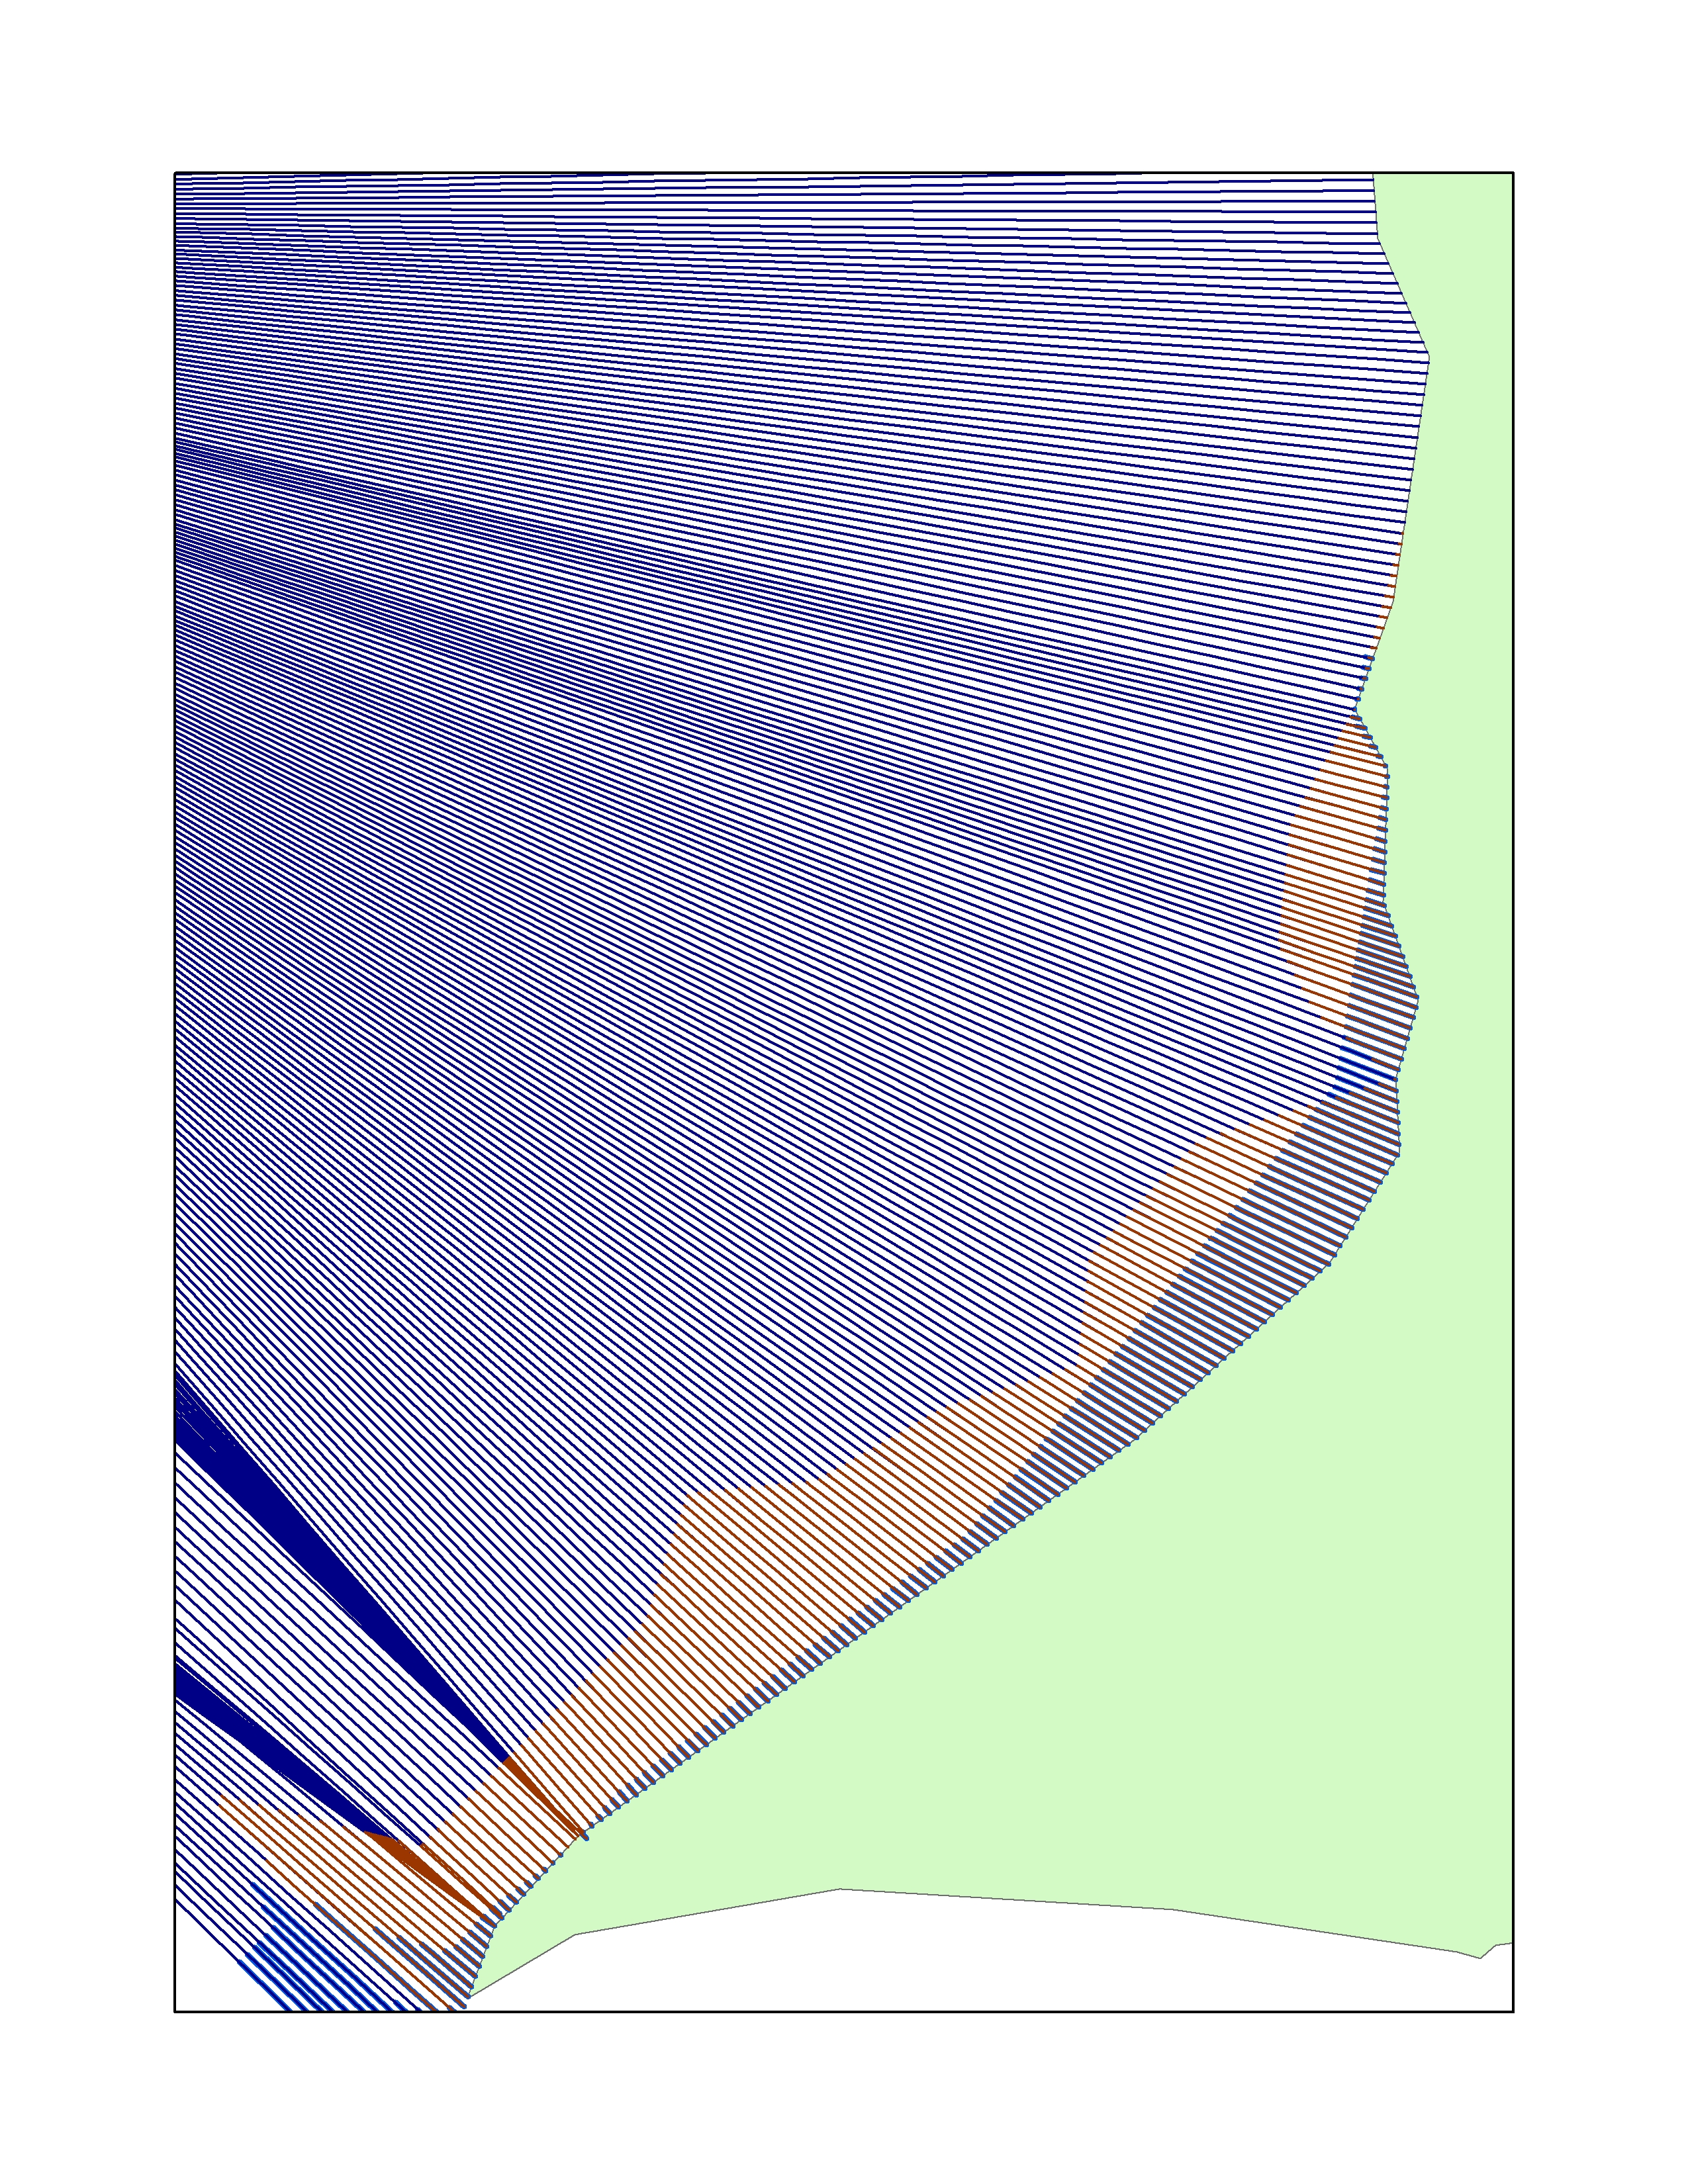
- Mark as New
- Bookmark
- Subscribe
- Mute
- Subscribe to RSS Feed
- Permalink
- Report Inappropriate Content
I believe you can follow these steps (sorry, can't test right now):
1.) Create Routes from your tangent lines
2.) Intersect the ice extent lines with the tangent lines to get intersection points (specify point as output type)
3.) Locate Features Along Routes (features = your intersection points) to get measures for each point
4.) Summary Statistics to get stats for each tangent line
- Mark as New
- Bookmark
- Subscribe
- Mute
- Subscribe to RSS Feed
- Permalink
- Report Inappropriate Content
looks like this approach may help.
Creating points at a specific distance from other points along a line
- Mark as New
- Bookmark
- Subscribe
- Mute
- Subscribe to RSS Feed
- Permalink
- Report Inappropriate Content
OK, I gave it a shot and this is what I got so far...
I took a random part of the globe:
... OK, I admit I georeferenced the image that was attached.
Digitized the coast line, and 4 ice edges (no to mucho detail) and started coding.
The process consists of the following steps:
- get the coast line polyline
- create a featureclass to store the routes (ice edges where each vertice has a m-value representing the relative position on the coast line)
- loop through the ice edges and fill the m-enabled featureclass with the ice edge routes
- create a table with events and fill with YEAR values and M values
- execute MakeRouteEventLayer_lr to generate a layer with point events based on the ice edge routes and the event table
- create a nested dictionary with the event points and relevant information
- get min, max and mean statistics from the nested dictionary
- ... generate polylines and write the resulting geometries and statistics to the output featureclass
Example area showing the ice edges with the event points created on the lines with the m value (the relative position on the coast line).
... and the resulting MIN, MAX and MEAN lines (comparing the event points on the ice edge lines based on the m-values and distance to the coast line) :
Code used:
import arcpy
def main():
import os
# input and output featureclasses
# fc_coast = r'D:\Xander\GeoNet\IceEdges\data.gdb\coast'
fc_coast = r'D:\Xander\GeoNet\IceEdges\data.gdb\coast_simple'
fc_ice = r'D:\Xander\GeoNet\IceEdges\data.gdb\ice_edges'
fld_id = 'YEAR' # should be unique long
fld_stats = 'Stats'
fld_dist = 'Distance'
fld_m_value = 'M_Value'
fld_loc_err = 'LOC_ERROR'
fc_routes = r'D:\Xander\GeoNet\IceEdges\data.gdb\routes_v04'
tbl_events = r'D:\Xander\GeoNet\IceEdges\data.gdb\tbl_events_v04'
fc_events = r'D:\Xander\GeoNet\IceEdges\data.gdb\events_v04'
fc_res = r'D:\Xander\GeoNet\IceEdges\data.gdb\result_v04'
# settings
ws, fc_name = os.path.split(fc_routes)
arcpy.env.workspace = ws
arcpy.env.overwriteOutput = True
steps = 1000
# get the coast line (asume first feature in coast fc)
coast_line = arcpy.da.SearchCursor(fc_coast,('SHAPE@')).next()[0]
# create output polyline zm featureclass
sr = arcpy.Describe(fc_coast).spatialReference
arcpy.CreateFeatureclass_management(ws, fc_name, "POLYLINE", None, "ENABLED", "DISABLED", sr)
# add field
arcpy.AddField_management(fc_routes, fld_id, "LONG")
# loop through ice edges and create dct with polyline m values
dct_polyline_m = {}
with arcpy.da.SearchCursor(fc_ice,('SHAPE@', fld_id)) as curs:
for row in curs:
year = row[1]
polyline_ice = row[0]
lst = []
for part in polyline_ice:
for pnt in part:
pntg_ice = arcpy.PointGeometry(pnt, sr)
pntg_on_line, m_value_coast, dist_to_coast, right_side = coast_line.queryPointAndDistance(pntg_ice, True)
pnt_m = arcpy.Point(pnt.X, pnt.Y, None, m_value_coast * 100.0)
lst.append(pnt_m)
polyline_m = arcpy.Polyline(arcpy.Array(lst), sr)
dct_polyline_m[year] = polyline_m
# create routes featureclass
with arcpy.da.InsertCursor(fc_routes, ('SHAPE@', fld_id)) as curs:
for year, polyline_m in dct_polyline_m.items():
curs.insertRow((polyline_m, year, ))
# create table with events
ws, tbl_name = os.path.split(tbl_events)
arcpy.CreateTable_management(ws, tbl_name)
arcpy.AddField_management(tbl_name, fld_id, "LONG")
arcpy.AddField_management(tbl_name, fld_m_value, "DOUBLE")
# get list of ID's (years)
lst_ids = sorted(list(set([r[0] for r in arcpy.da.SearchCursor(fc_ice, (fld_id))])))
# fill events table
with arcpy.da.InsertCursor(tbl_events, (fld_id, fld_m_value)) as curs:
for step in range(steps + 1):
m = float(step) / float(steps) * 100.0
for y in lst_ids:
curs.insertRow((y, m, ))
# create de route events
event_props = "{0} POINT {1}".format(fld_id, fld_m_value)
arcpy.MakeRouteEventLayer_lr(in_routes=fc_routes, route_id_field=fld_id,
in_table=tbl_events,
in_event_properties=event_props,
out_layer="EventPoints", offset_field="",
add_error_field="ERROR_FIELD",
add_angle_field="NO_ANGLE_FIELD",
angle_type="NORMAL",
complement_angle="ANGLE",
offset_direction="LEFT",
point_event_type="POINT")
# write the events to a fc
arcpy.CopyFeatures_management("EventPoints", fc_events)
# generate nested dct with event points and distance to coast (only no error events)
where = "{0} = 'NO ERROR'".format(arcpy.AddFieldDelimiters(fc_events, fld_loc_err))
dct_all = {}
lst_m = []
with arcpy.da.SearchCursor(fc_events,
('SHAPE@', fld_id, fld_m_value),
where_clause=where) as curs:
for row in curs:
pntg = row[0]
y = row[1]
m = row[2]
lst_m.append(m)
d = pntg.distanceTo(coast_line)
if m in dct_all:
dct = dct_all = [pntg, d]
dct_all = dct
else:
dct = {y: [pntg, d]}
dct_all = dct
# create list of m values
lst_m = sorted(list(set(lst_m)))
# stats
lst_min, dist_min = getStatPointsFromDct(dct_all, lst_m, lst_ids, "MIN")
lst_max, dist_max = getStatPointsFromDct(dct_all, lst_m, lst_ids, "MAX")
lst_mean, dist_mean = getStatPointsFromDct(dct_all, lst_m, lst_ids, "MEAN")
# create output fc for result
ws, fc_name = os.path.split(fc_res)
arcpy.CreateFeatureclass_management(ws, fc_name, "POLYLINE", None, "ENABLED", "DISABLED", sr)
# add fields to result fc
arcpy.AddField_management(fc_res, fld_stats, "TEXT", None, None, 25)
arcpy.AddField_management(fc_res, fld_dist, "DOUBLE")
# write results to output featureclass
with arcpy.da.InsertCursor(fc_res, ('SHAPE@', fld_stats, fld_dist)) as curs:
# MIN:
polyline = arcpy.Polyline(arcpy.Array(lst_min), sr)
curs.insertRow((polyline, "MIN", dist_min, ))
# MAX:
polyline = arcpy.Polyline(arcpy.Array(lst_max), sr)
curs.insertRow((polyline, "MAX", dist_max, ))
# MEAN:
polyline = arcpy.Polyline(arcpy.Array(lst_mean), sr)
curs.insertRow((polyline, "MEAN", dist_mean, ))
def getStatPointsFromDct(dct_all, lst_m, lst_ids, stat):
lst_polyline = []
lst_dist = []
for m in lst_m:
if m in dct_all:
dct = dct_allAt second intent I simplified the cost line (less detail, since the more detail and strange forms it has, the bigger the effect on erroneous distribution of the events over the edge lines:
after the simplification of the coast line (with a higher step setting):
- Mark as New
- Bookmark
- Subscribe
- Mute
- Subscribe to RSS Feed
- Permalink
- Report Inappropriate Content
interesting implementation Xander and some great points raised.
- Mark as New
- Bookmark
- Subscribe
- Mute
- Subscribe to RSS Feed
- Permalink
- Report Inappropriate Content
Thanks Dan. I left the median out, since that would raise more discussion related to how to define the median point based on 4 lines in my case. I would prefer to take the two median points and determine the middle between them, but not sure if that would be correct.
- Mark as New
- Bookmark
- Subscribe
- Mute
- Subscribe to RSS Feed
- Permalink
- Report Inappropriate Content
Short answer.... take the "middle" between the middle two lines for an even set of lines... take the middle line if the line set is odd
cavaet... the sea ice people in my department do not necessarily share the views expressed here 
Perhaps branch this as a discussion
read below only if you really need to
------------------------------------
medians are tricky, for polygons of predictable geometry it is fairly well agreed upon, but for complex geometries, you are talking about a medial axis (skeleton) but still the controversy would remain
- Is the median the middle of the values of X and Y?
- Do you account for orientation when you are performing the above?
- If you only have the bounding points and assumed edges, is the median space the area delineated by the normal axis lines extending inwards to the other side? Where those lines meet, they may form more than one point of intersection. Do you then go back to the beginning and proceed downward again?
- It is "easy" for regular polygons and few well-behaving lines.
In your case, you have 4 lines. the question becomes, where and how do you collapse them into a single medial point. I would argue against the average for the very reason that 3 of the 4 lines may be closely spaced and the 4th a some distance. As for any median, what represent the distribution's middleness based upon sequential position rather than arithmetic average. So following those rules that apply to other properties, you could take the middle point in the ordered list of attributes. Should the distribution be even, it is generally agreed that the average of the middle two is used... if odd, the middle value is used (although, there is some "issues" associated with using that definition). A plausible solution would be to take the middle two lines out of the four and "collapse to center line" aka, create a medial axis/skeleton if you consider the linear distribution as simply representing a long polygon.
In short...no one can fault any descriptor of the median, since it is a nebulous quantity for univariate discrete properties, it becomes "middle-ness" for continuous, and when you throw in more than one dimension you often find yourself flipping back and forth between boundaries/lines to points to boundaries/lines to points etc.
- Mark as New
- Bookmark
- Subscribe
- Mute
- Subscribe to RSS Feed
- Permalink
- Report Inappropriate Content
Thanks so much, I will try this now